Luxembourger vs Scotch-Irish Householder Income Ages 45 - 64 years
COMPARE
Luxembourger
Scotch-Irish
Householder Income Ages 45 - 64 years
Householder Income Ages 45 - 64 years Comparison
Luxembourgers
Scotch-Irish
$103,536
HOUSEHOLDER INCOME AGES 45 - 64 YEARS
83.3/ 100
METRIC RATING
142nd/ 347
METRIC RANK
$97,073
HOUSEHOLDER INCOME AGES 45 - 64 YEARS
16.4/ 100
METRIC RATING
208th/ 347
METRIC RANK
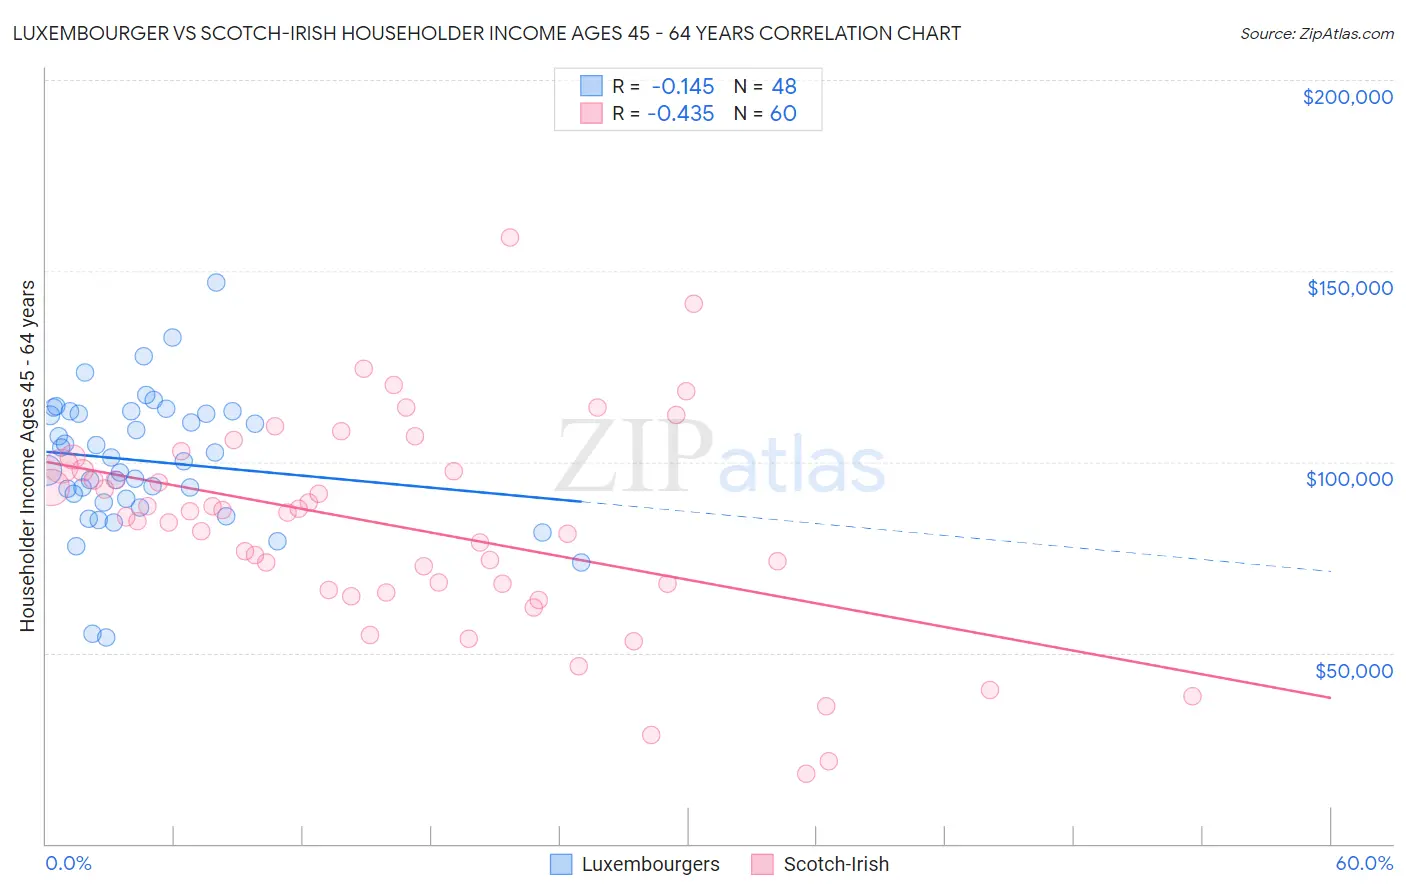
Luxembourger vs Scotch-Irish Householder Income Ages 45 - 64 years Correlation Chart
The statistical analysis conducted on geographies consisting of 144,593,524 people shows a poor negative correlation between the proportion of Luxembourgers and household income with householder between the ages 45 and 64 in the United States with a correlation coefficient (R) of -0.145 and weighted average of $103,536. Similarly, the statistical analysis conducted on geographies consisting of 545,781,599 people shows a moderate negative correlation between the proportion of Scotch-Irish and household income with householder between the ages 45 and 64 in the United States with a correlation coefficient (R) of -0.435 and weighted average of $97,073, a difference of 6.7%.
Householder Income Ages 45 - 64 years Correlation Summary
| Measurement | Luxembourger | Scotch-Irish |
| Minimum | $54,000 | $18,333 |
| Maximum | $147,008 | $158,793 |
| Range | $93,008 | $140,460 |
| Mean | $100,224 | $82,834 |
| Median | $100,694 | $86,155 |
| Interquartile 25% (IQ1) | $89,750 | $67,136 |
| Interquartile 75% (IQ3) | $112,857 | $98,260 |
| Interquartile Range (IQR) | $23,108 | $31,124 |
| Standard Deviation (Sample) | $17,750 | $27,504 |
| Standard Deviation (Population) | $17,564 | $27,274 |
Similar Demographics by Householder Income Ages 45 - 64 years
Demographics Similar to Luxembourgers by Householder Income Ages 45 - 64 years
In terms of householder income ages 45 - 64 years, the demographic groups most similar to Luxembourgers are Serbian ($103,522, a difference of 0.010%), Czech ($103,507, a difference of 0.030%), Immigrants from Uganda ($103,584, a difference of 0.050%), Ugandan ($103,472, a difference of 0.060%), and Immigrants from Chile ($103,412, a difference of 0.12%).
| Demographics | Rating | Rank | Householder Income Ages 45 - 64 years |
| Brazilians | 88.6 /100 | #135 | Excellent $104,408 |
| Taiwanese | 87.4 /100 | #136 | Excellent $104,180 |
| Hungarians | 85.8 /100 | #137 | Excellent $103,913 |
| Ethiopians | 84.7 /100 | #138 | Excellent $103,736 |
| Immigrants | Oceania | 84.5 /100 | #139 | Excellent $103,705 |
| Norwegians | 84.3 /100 | #140 | Excellent $103,682 |
| Immigrants | Uganda | 83.7 /100 | #141 | Excellent $103,584 |
| Luxembourgers | 83.3 /100 | #142 | Excellent $103,536 |
| Serbians | 83.2 /100 | #143 | Excellent $103,522 |
| Czechs | 83.1 /100 | #144 | Excellent $103,507 |
| Ugandans | 82.9 /100 | #145 | Excellent $103,472 |
| Immigrants | Chile | 82.5 /100 | #146 | Excellent $103,412 |
| Basques | 82.3 /100 | #147 | Excellent $103,387 |
| Immigrants | Germany | 81.5 /100 | #148 | Excellent $103,282 |
| Immigrants | Sierra Leone | 81.1 /100 | #149 | Excellent $103,227 |
Demographics Similar to Scotch-Irish by Householder Income Ages 45 - 64 years
In terms of householder income ages 45 - 64 years, the demographic groups most similar to Scotch-Irish are Ghanaian ($97,277, a difference of 0.21%), Immigrants from Colombia ($97,290, a difference of 0.22%), Immigrants from Africa ($97,284, a difference of 0.22%), Japanese ($96,834, a difference of 0.25%), and Tsimshian ($96,783, a difference of 0.30%).
| Demographics | Rating | Rank | Householder Income Ages 45 - 64 years |
| Yugoslavians | 20.0 /100 | #201 | Fair $97,558 |
| Tlingit-Haida | 18.9 /100 | #202 | Poor $97,417 |
| Immigrants | Thailand | 18.8 /100 | #203 | Poor $97,400 |
| Immigrants | Eritrea | 18.6 /100 | #204 | Poor $97,373 |
| Immigrants | Colombia | 18.0 /100 | #205 | Poor $97,290 |
| Immigrants | Africa | 17.9 /100 | #206 | Poor $97,284 |
| Ghanaians | 17.9 /100 | #207 | Poor $97,277 |
| Scotch-Irish | 16.4 /100 | #208 | Poor $97,073 |
| Japanese | 14.8 /100 | #209 | Poor $96,834 |
| Tsimshian | 14.5 /100 | #210 | Poor $96,783 |
| Immigrants | Cambodia | 13.0 /100 | #211 | Poor $96,537 |
| Venezuelans | 12.6 /100 | #212 | Poor $96,460 |
| Immigrants | Uruguay | 10.7 /100 | #213 | Poor $96,086 |
| Panamanians | 10.6 /100 | #214 | Poor $96,066 |
| Nigerians | 8.2 /100 | #215 | Tragic $95,492 |