Luxembourger vs Immigrants from Jordan 8th Grade
COMPARE
Luxembourger
Immigrants from Jordan
8th Grade
8th Grade Comparison
Luxembourgers
Immigrants from Jordan
97.0%
8TH GRADE
100.0/ 100
METRIC RATING
34th/ 347
METRIC RANK
95.9%
8TH GRADE
79.5/ 100
METRIC RATING
153rd/ 347
METRIC RANK
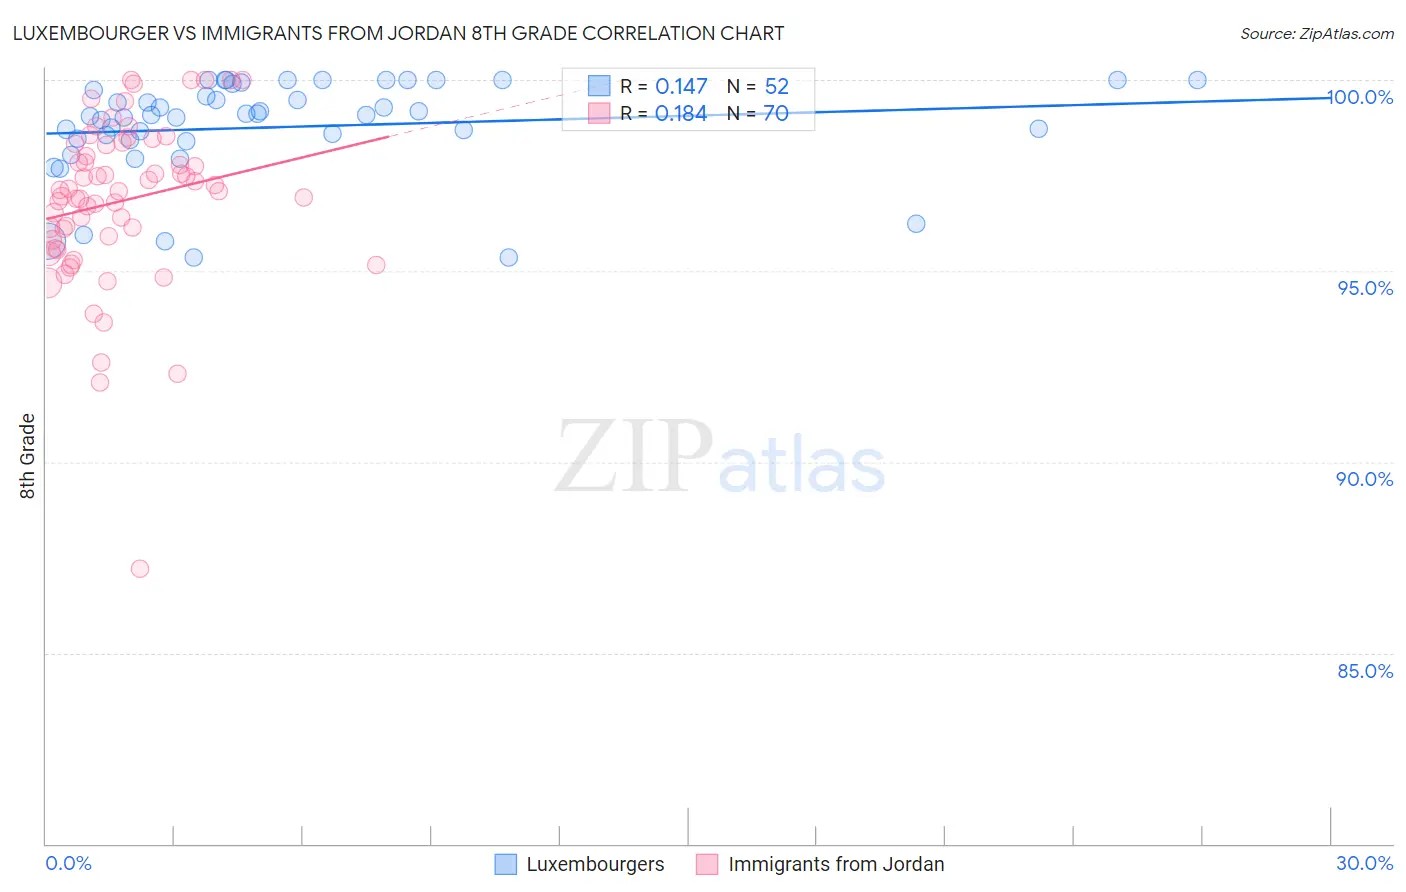
Luxembourger vs Immigrants from Jordan 8th Grade Correlation Chart
The statistical analysis conducted on geographies consisting of 144,675,512 people shows a poor positive correlation between the proportion of Luxembourgers and percentage of population with at least 8th grade education in the United States with a correlation coefficient (R) of 0.147 and weighted average of 97.0%. Similarly, the statistical analysis conducted on geographies consisting of 181,269,353 people shows a poor positive correlation between the proportion of Immigrants from Jordan and percentage of population with at least 8th grade education in the United States with a correlation coefficient (R) of 0.184 and weighted average of 95.9%, a difference of 1.1%.
8th Grade Correlation Summary
| Measurement | Luxembourger | Immigrants from Jordan |
| Minimum | 95.3% | 87.2% |
| Maximum | 100.0% | 100.0% |
| Range | 4.7% | 12.8% |
| Mean | 98.8% | 96.8% |
| Median | 99.1% | 97.1% |
| Interquartile 25% (IQ1) | 98.5% | 95.8% |
| Interquartile 75% (IQ3) | 99.8% | 98.3% |
| Interquartile Range (IQR) | 1.4% | 2.5% |
| Standard Deviation (Sample) | 1.3% | 2.2% |
| Standard Deviation (Population) | 1.3% | 2.1% |
Similar Demographics by 8th Grade
Demographics Similar to Luxembourgers by 8th Grade
In terms of 8th grade, the demographic groups most similar to Luxembourgers are Alaska Native (97.0%, a difference of 0.010%), Belgian (97.0%, a difference of 0.020%), Latvian (97.0%, a difference of 0.020%), Swiss (97.0%, a difference of 0.030%), and Yup'ik (97.0%, a difference of 0.040%).
| Demographics | Rating | Rank | 8th Grade |
| Scotch-Irish | 100.0 /100 | #27 | Exceptional 97.1% |
| Italians | 100.0 /100 | #28 | Exceptional 97.1% |
| Europeans | 100.0 /100 | #29 | Exceptional 97.1% |
| Sioux | 100.0 /100 | #30 | Exceptional 97.1% |
| Chippewa | 100.0 /100 | #31 | Exceptional 97.1% |
| Yup'ik | 100.0 /100 | #32 | Exceptional 97.0% |
| Swiss | 100.0 /100 | #33 | Exceptional 97.0% |
| Luxembourgers | 100.0 /100 | #34 | Exceptional 97.0% |
| Alaska Natives | 100.0 /100 | #35 | Exceptional 97.0% |
| Belgians | 100.0 /100 | #36 | Exceptional 97.0% |
| Latvians | 100.0 /100 | #37 | Exceptional 97.0% |
| British | 100.0 /100 | #38 | Exceptional 97.0% |
| Hungarians | 100.0 /100 | #39 | Exceptional 97.0% |
| Inupiat | 100.0 /100 | #40 | Exceptional 97.0% |
| Eastern Europeans | 100.0 /100 | #41 | Exceptional 97.0% |
Demographics Similar to Immigrants from Jordan by 8th Grade
In terms of 8th grade, the demographic groups most similar to Immigrants from Jordan are Hopi (95.9%, a difference of 0.0%), Immigrants from Russia (96.0%, a difference of 0.010%), Blackfeet (96.0%, a difference of 0.010%), French American Indian (96.0%, a difference of 0.010%), and Immigrants from Israel (96.0%, a difference of 0.020%).
| Demographics | Rating | Rank | 8th Grade |
| Israelis | 84.1 /100 | #146 | Excellent 96.0% |
| Colville | 84.0 /100 | #147 | Excellent 96.0% |
| Albanians | 83.1 /100 | #148 | Excellent 96.0% |
| Immigrants | Israel | 81.3 /100 | #149 | Excellent 96.0% |
| Immigrants | Russia | 80.9 /100 | #150 | Excellent 96.0% |
| Blackfeet | 80.8 /100 | #151 | Excellent 96.0% |
| French American Indians | 80.6 /100 | #152 | Excellent 96.0% |
| Immigrants | Jordan | 79.5 /100 | #153 | Good 95.9% |
| Hopi | 79.4 /100 | #154 | Good 95.9% |
| Kenyans | 74.5 /100 | #155 | Good 95.9% |
| Ugandans | 74.1 /100 | #156 | Good 95.9% |
| Immigrants | Taiwan | 70.5 /100 | #157 | Good 95.9% |
| Arabs | 69.4 /100 | #158 | Good 95.9% |
| Immigrants | Kazakhstan | 68.4 /100 | #159 | Good 95.9% |
| Seminole | 67.7 /100 | #160 | Good 95.8% |