Immigrants from Malaysia vs Eastern European Householder Income Over 65 years
COMPARE
Immigrants from Malaysia
Eastern European
Householder Income Over 65 years
Householder Income Over 65 years Comparison
Immigrants from Malaysia
Eastern Europeans
$65,497
HOUSEHOLDER INCOME OVER 65 YEARS
99.1/ 100
METRIC RATING
67th/ 347
METRIC RANK
$70,470
HOUSEHOLDER INCOME OVER 65 YEARS
100.0/ 100
METRIC RATING
18th/ 347
METRIC RANK
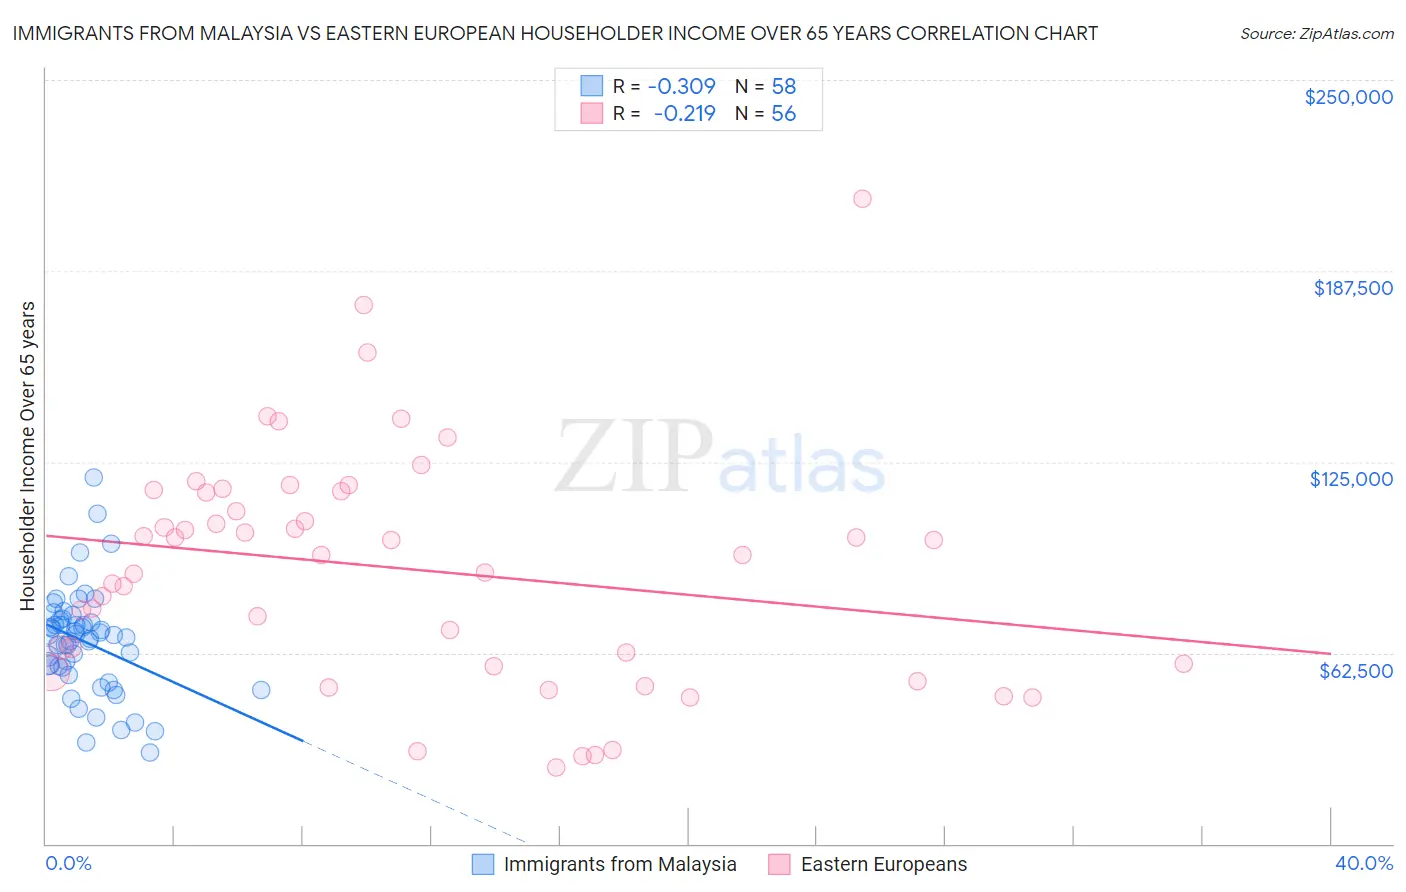
Immigrants from Malaysia vs Eastern European Householder Income Over 65 years Correlation Chart
The statistical analysis conducted on geographies consisting of 197,759,945 people shows a mild negative correlation between the proportion of Immigrants from Malaysia and household income with householder over the age of 65 in the United States with a correlation coefficient (R) of -0.309 and weighted average of $65,497. Similarly, the statistical analysis conducted on geographies consisting of 459,430,527 people shows a weak negative correlation between the proportion of Eastern Europeans and household income with householder over the age of 65 in the United States with a correlation coefficient (R) of -0.219 and weighted average of $70,470, a difference of 7.6%.
Householder Income Over 65 years Correlation Summary
| Measurement | Immigrants from Malaysia | Eastern European |
| Minimum | $30,000 | $24,862 |
| Maximum | $119,688 | $211,250 |
| Range | $89,688 | $186,388 |
| Mean | $65,996 | $90,025 |
| Median | $67,851 | $94,688 |
| Interquartile 25% (IQ1) | $57,508 | $58,403 |
| Interquartile 75% (IQ3) | $73,101 | $115,041 |
| Interquartile Range (IQR) | $15,593 | $56,638 |
| Standard Deviation (Sample) | $17,025 | $38,316 |
| Standard Deviation (Population) | $16,878 | $37,972 |
Similar Demographics by Householder Income Over 65 years
Demographics Similar to Immigrants from Malaysia by Householder Income Over 65 years
In terms of householder income over 65 years, the demographic groups most similar to Immigrants from Malaysia are Egyptian ($65,441, a difference of 0.090%), Samoan ($65,427, a difference of 0.11%), South African ($65,652, a difference of 0.24%), Mongolian ($65,326, a difference of 0.26%), and Greek ($65,306, a difference of 0.29%).
| Demographics | Rating | Rank | Householder Income Over 65 years |
| Immigrants | Lithuania | 99.5 /100 | #60 | Exceptional $66,087 |
| Maltese | 99.5 /100 | #61 | Exceptional $66,027 |
| Immigrants | Sierra Leone | 99.5 /100 | #62 | Exceptional $66,009 |
| Marshallese | 99.4 /100 | #63 | Exceptional $65,874 |
| Zimbabweans | 99.4 /100 | #64 | Exceptional $65,854 |
| Immigrants | England | 99.3 /100 | #65 | Exceptional $65,715 |
| South Africans | 99.3 /100 | #66 | Exceptional $65,652 |
| Immigrants | Malaysia | 99.1 /100 | #67 | Exceptional $65,497 |
| Egyptians | 99.1 /100 | #68 | Exceptional $65,441 |
| Samoans | 99.1 /100 | #69 | Exceptional $65,427 |
| Mongolians | 99.0 /100 | #70 | Exceptional $65,326 |
| Greeks | 98.9 /100 | #71 | Exceptional $65,306 |
| Argentineans | 98.9 /100 | #72 | Exceptional $65,246 |
| Immigrants | Ethiopia | 98.9 /100 | #73 | Exceptional $65,238 |
| Lithuanians | 98.8 /100 | #74 | Exceptional $65,209 |
Demographics Similar to Eastern Europeans by Householder Income Over 65 years
In terms of householder income over 65 years, the demographic groups most similar to Eastern Europeans are Immigrants from Korea ($70,696, a difference of 0.32%), Indian (Asian) ($70,238, a difference of 0.33%), Immigrants from South Central Asia ($70,103, a difference of 0.52%), Okinawan ($70,846, a difference of 0.53%), and Native Hawaiian ($71,021, a difference of 0.78%).
| Demographics | Rating | Rank | Householder Income Over 65 years |
| Thais | 100.0 /100 | #11 | Exceptional $72,099 |
| Cypriots | 100.0 /100 | #12 | Exceptional $71,714 |
| Immigrants | Hong Kong | 100.0 /100 | #13 | Exceptional $71,567 |
| Burmese | 100.0 /100 | #14 | Exceptional $71,139 |
| Native Hawaiians | 100.0 /100 | #15 | Exceptional $71,021 |
| Okinawans | 100.0 /100 | #16 | Exceptional $70,846 |
| Immigrants | Korea | 100.0 /100 | #17 | Exceptional $70,696 |
| Eastern Europeans | 100.0 /100 | #18 | Exceptional $70,470 |
| Indians (Asian) | 100.0 /100 | #19 | Exceptional $70,238 |
| Immigrants | South Central Asia | 100.0 /100 | #20 | Exceptional $70,103 |
| Immigrants | Eastern Asia | 100.0 /100 | #21 | Exceptional $69,872 |
| Immigrants | Israel | 100.0 /100 | #22 | Exceptional $69,857 |
| Immigrants | Japan | 100.0 /100 | #23 | Exceptional $69,774 |
| Immigrants | Sweden | 100.0 /100 | #24 | Exceptional $69,722 |
| Immigrants | Belgium | 100.0 /100 | #25 | Exceptional $69,703 |