Immigrants from Czechoslovakia vs Honduran Median Male Earnings
COMPARE
Immigrants from Czechoslovakia
Honduran
Median Male Earnings
Median Male Earnings Comparison
Immigrants from Czechoslovakia
Hondurans
$62,217
MEDIAN MALE EARNINGS
99.9/ 100
METRIC RATING
46th/ 347
METRIC RANK
$46,374
MEDIAN MALE EARNINGS
0.0/ 100
METRIC RATING
313th/ 347
METRIC RANK
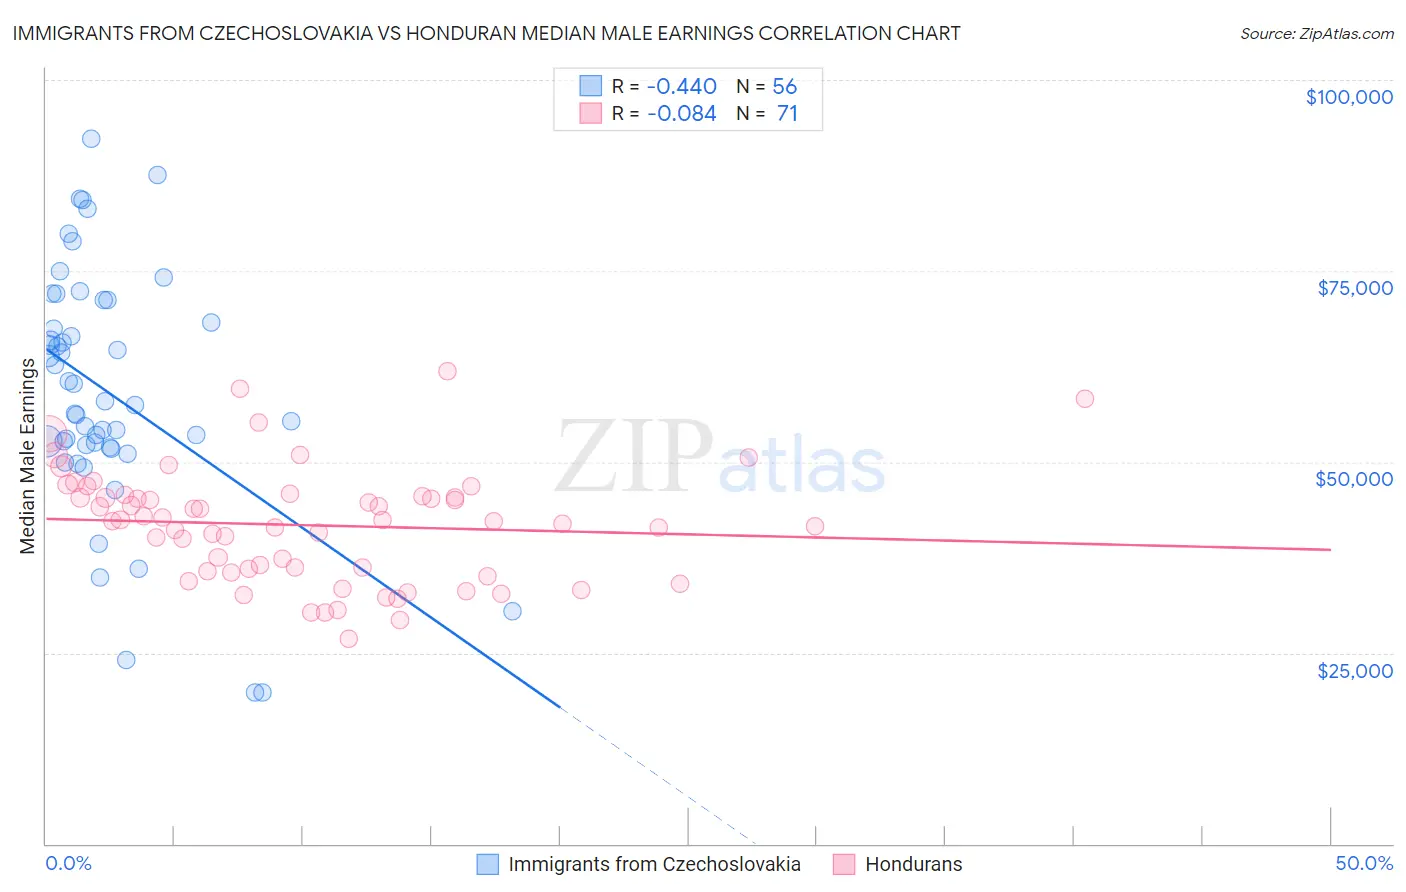
Immigrants from Czechoslovakia vs Honduran Median Male Earnings Correlation Chart
The statistical analysis conducted on geographies consisting of 195,431,341 people shows a moderate negative correlation between the proportion of Immigrants from Czechoslovakia and median male earnings in the United States with a correlation coefficient (R) of -0.440 and weighted average of $62,217. Similarly, the statistical analysis conducted on geographies consisting of 357,792,552 people shows a slight negative correlation between the proportion of Hondurans and median male earnings in the United States with a correlation coefficient (R) of -0.084 and weighted average of $46,374, a difference of 34.2%.
Median Male Earnings Correlation Summary
| Measurement | Immigrants from Czechoslovakia | Honduran |
| Minimum | $19,792 | $26,786 |
| Maximum | $92,305 | $61,786 |
| Range | $72,513 | $35,000 |
| Mean | $59,087 | $41,717 |
| Median | $57,746 | $42,264 |
| Interquartile 25% (IQ1) | $51,971 | $35,639 |
| Interquartile 75% (IQ3) | $69,695 | $45,572 |
| Interquartile Range (IQR) | $17,724 | $9,933 |
| Standard Deviation (Sample) | $15,934 | $7,373 |
| Standard Deviation (Population) | $15,791 | $7,321 |
Similar Demographics by Median Male Earnings
Demographics Similar to Immigrants from Czechoslovakia by Median Male Earnings
In terms of median male earnings, the demographic groups most similar to Immigrants from Czechoslovakia are Immigrants from Austria ($62,164, a difference of 0.090%), Immigrants from Malaysia ($62,121, a difference of 0.15%), Bulgarian ($62,378, a difference of 0.26%), Immigrants from Europe ($62,057, a difference of 0.26%), and Cambodian ($62,516, a difference of 0.48%).
| Demographics | Rating | Rank | Median Male Earnings |
| Immigrants | South Africa | 100.0 /100 | #39 | Exceptional $62,899 |
| Australians | 100.0 /100 | #40 | Exceptional $62,857 |
| Immigrants | Turkey | 100.0 /100 | #41 | Exceptional $62,728 |
| Immigrants | Greece | 100.0 /100 | #42 | Exceptional $62,689 |
| Immigrants | Belarus | 100.0 /100 | #43 | Exceptional $62,658 |
| Cambodians | 100.0 /100 | #44 | Exceptional $62,516 |
| Bulgarians | 100.0 /100 | #45 | Exceptional $62,378 |
| Immigrants | Czechoslovakia | 99.9 /100 | #46 | Exceptional $62,217 |
| Immigrants | Austria | 99.9 /100 | #47 | Exceptional $62,164 |
| Immigrants | Malaysia | 99.9 /100 | #48 | Exceptional $62,121 |
| Immigrants | Europe | 99.9 /100 | #49 | Exceptional $62,057 |
| Bhutanese | 99.9 /100 | #50 | Exceptional $61,759 |
| Estonians | 99.9 /100 | #51 | Exceptional $61,710 |
| Immigrants | Norway | 99.9 /100 | #52 | Exceptional $61,628 |
| South Africans | 99.9 /100 | #53 | Exceptional $61,460 |
Demographics Similar to Hondurans by Median Male Earnings
In terms of median male earnings, the demographic groups most similar to Hondurans are Chippewa ($46,368, a difference of 0.010%), Hispanic or Latino ($46,419, a difference of 0.10%), Apache ($46,429, a difference of 0.12%), Immigrants from Guatemala ($46,244, a difference of 0.28%), and Immigrants from Caribbean ($46,193, a difference of 0.39%).
| Demographics | Rating | Rank | Median Male Earnings |
| Dutch West Indians | 0.0 /100 | #306 | Tragic $46,656 |
| Immigrants | Dominican Republic | 0.0 /100 | #307 | Tragic $46,655 |
| Ottawa | 0.0 /100 | #308 | Tragic $46,611 |
| Creek | 0.0 /100 | #309 | Tragic $46,594 |
| Cubans | 0.0 /100 | #310 | Tragic $46,580 |
| Apache | 0.0 /100 | #311 | Tragic $46,429 |
| Hispanics or Latinos | 0.0 /100 | #312 | Tragic $46,419 |
| Hondurans | 0.0 /100 | #313 | Tragic $46,374 |
| Chippewa | 0.0 /100 | #314 | Tragic $46,368 |
| Immigrants | Guatemala | 0.0 /100 | #315 | Tragic $46,244 |
| Immigrants | Caribbean | 0.0 /100 | #316 | Tragic $46,193 |
| Mexicans | 0.0 /100 | #317 | Tragic $46,147 |
| Cheyenne | 0.0 /100 | #318 | Tragic $46,062 |
| Haitians | 0.0 /100 | #319 | Tragic $45,903 |
| Immigrants | Honduras | 0.0 /100 | #320 | Tragic $45,787 |