Immigrants vs Welsh Householder Income Over 65 years
COMPARE
Immigrants
Welsh
Householder Income Over 65 years
Householder Income Over 65 years Comparison
Immigrants
Welsh
$59,656
HOUSEHOLDER INCOME OVER 65 YEARS
20.2/ 100
METRIC RATING
199th/ 347
METRIC RANK
$60,666
HOUSEHOLDER INCOME OVER 65 YEARS
42.2/ 100
METRIC RATING
179th/ 347
METRIC RANK
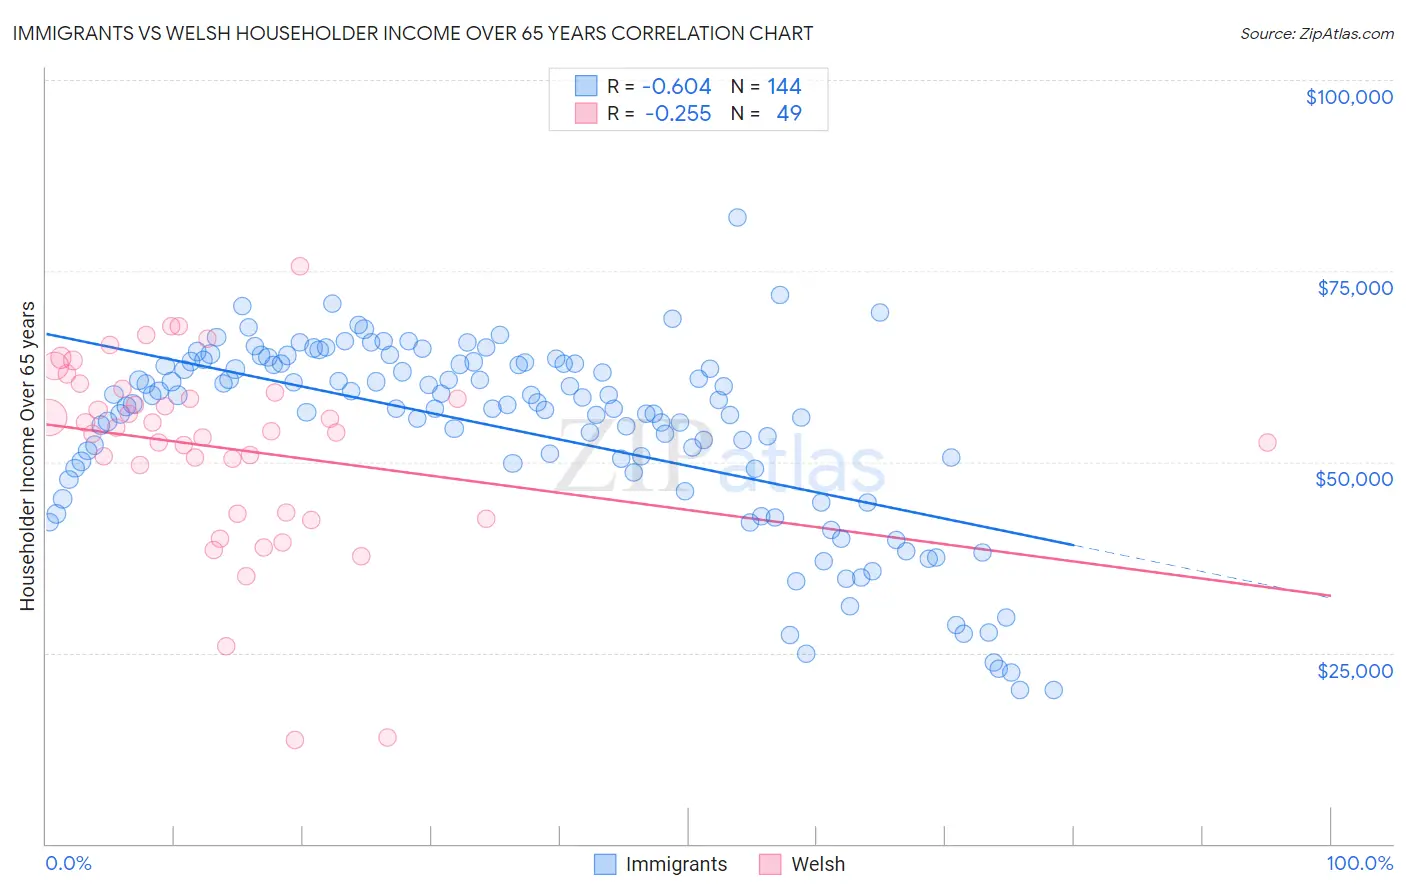
Immigrants vs Welsh Householder Income Over 65 years Correlation Chart
The statistical analysis conducted on geographies consisting of 571,696,580 people shows a significant negative correlation between the proportion of Immigrants and household income with householder over the age of 65 in the United States with a correlation coefficient (R) of -0.604 and weighted average of $59,656. Similarly, the statistical analysis conducted on geographies consisting of 525,240,397 people shows a weak negative correlation between the proportion of Welsh and household income with householder over the age of 65 in the United States with a correlation coefficient (R) of -0.255 and weighted average of $60,666, a difference of 1.7%.
Householder Income Over 65 years Correlation Summary
| Measurement | Immigrants | Welsh |
| Minimum | $20,075 | $13,664 |
| Maximum | $81,974 | $75,625 |
| Range | $61,899 | $61,961 |
| Mean | $54,149 | $51,794 |
| Median | $57,563 | $53,958 |
| Interquartile 25% (IQ1) | $49,162 | $43,354 |
| Interquartile 75% (IQ3) | $62,877 | $59,278 |
| Interquartile Range (IQR) | $13,715 | $15,924 |
| Standard Deviation (Sample) | $12,348 | $12,598 |
| Standard Deviation (Population) | $12,305 | $12,468 |
Demographics Similar to Immigrants and Welsh by Householder Income Over 65 years
In terms of householder income over 65 years, the demographic groups most similar to Immigrants are Moroccan ($59,683, a difference of 0.050%), Immigrants from Kenya ($59,710, a difference of 0.090%), German ($59,730, a difference of 0.12%), Immigrants from Iraq ($59,824, a difference of 0.28%), and Immigrants from Africa ($59,837, a difference of 0.30%). Similarly, the demographic groups most similar to Welsh are Immigrants from Morocco ($60,647, a difference of 0.030%), Celtic ($60,608, a difference of 0.10%), Czechoslovakian ($60,581, a difference of 0.14%), Kenyan ($60,514, a difference of 0.25%), and Iraqi ($60,466, a difference of 0.33%).
| Demographics | Rating | Rank | Householder Income Over 65 years |
| Welsh | 42.2 /100 | #179 | Average $60,666 |
| Immigrants | Morocco | 41.7 /100 | #180 | Average $60,647 |
| Celtics | 40.7 /100 | #181 | Average $60,608 |
| Czechoslovakians | 40.0 /100 | #182 | Average $60,581 |
| Kenyans | 38.4 /100 | #183 | Fair $60,514 |
| Iraqis | 37.2 /100 | #184 | Fair $60,466 |
| Albanians | 32.0 /100 | #185 | Fair $60,249 |
| Slovenes | 31.8 /100 | #186 | Fair $60,241 |
| Immigrants | Thailand | 31.3 /100 | #187 | Fair $60,217 |
| Immigrants | Eritrea | 28.6 /100 | #188 | Fair $60,096 |
| Ghanaians | 27.5 /100 | #189 | Fair $60,043 |
| Puget Sound Salish | 25.3 /100 | #190 | Fair $59,934 |
| Belgians | 24.9 /100 | #191 | Fair $59,915 |
| South Americans | 23.8 /100 | #192 | Fair $59,854 |
| Immigrants | Costa Rica | 23.6 /100 | #193 | Fair $59,848 |
| Immigrants | Africa | 23.4 /100 | #194 | Fair $59,837 |
| Immigrants | Iraq | 23.2 /100 | #195 | Fair $59,824 |
| Germans | 21.5 /100 | #196 | Fair $59,730 |
| Immigrants | Kenya | 21.1 /100 | #197 | Fair $59,710 |
| Moroccans | 20.7 /100 | #198 | Fair $59,683 |
| Immigrants | Immigrants | 20.2 /100 | #199 | Fair $59,656 |