Immigrants from Indonesia vs Asian Median Female Earnings
COMPARE
Immigrants from Indonesia
Asian
Median Female Earnings
Median Female Earnings Comparison
Immigrants from Indonesia
Asians
$43,412
MEDIAN FEMALE EARNINGS
100.0/ 100
METRIC RATING
48th/ 347
METRIC RANK
$44,586
MEDIAN FEMALE EARNINGS
100.0/ 100
METRIC RATING
30th/ 347
METRIC RANK
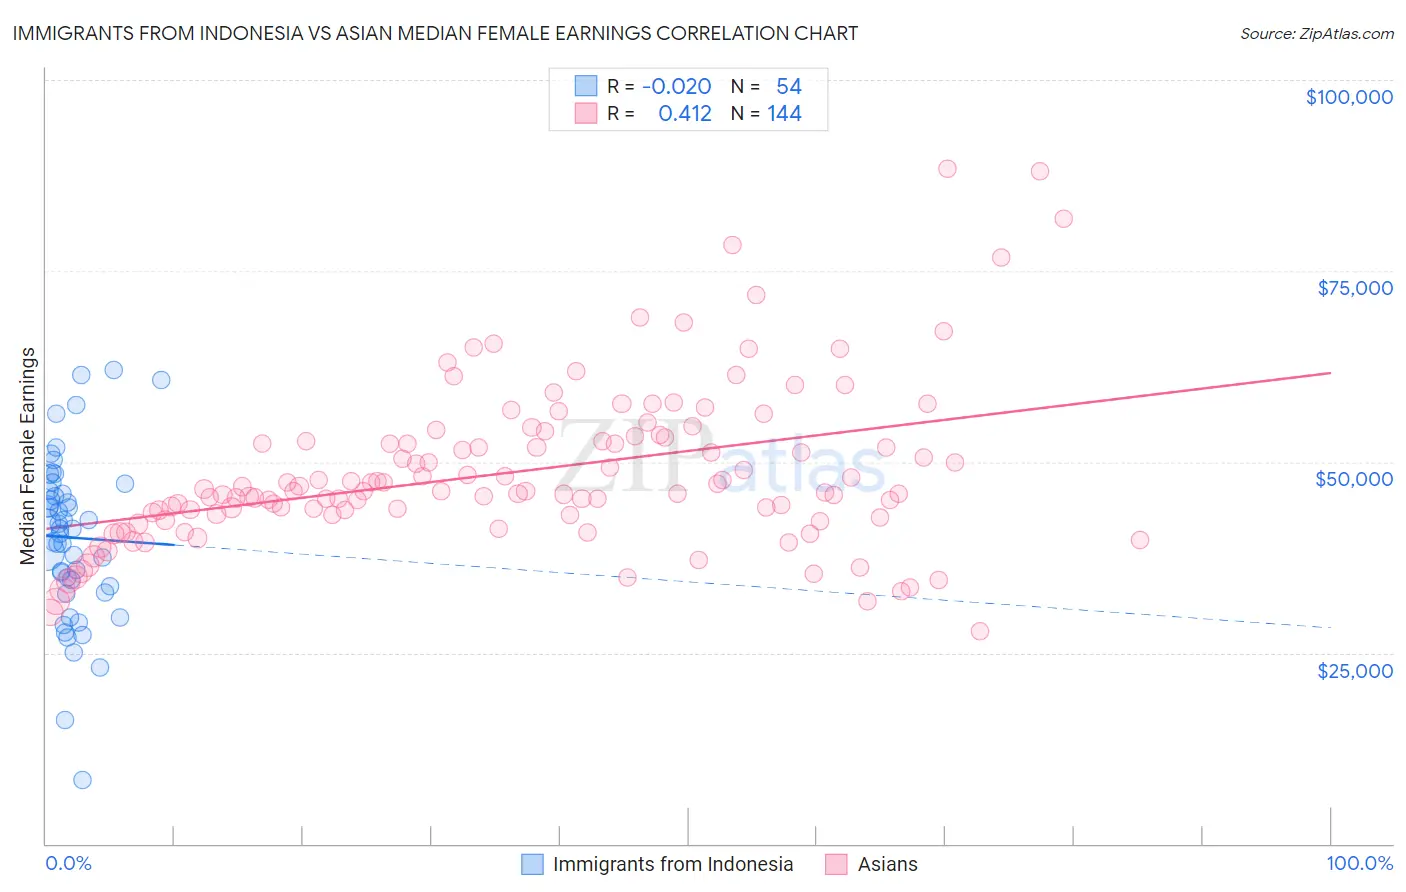
Immigrants from Indonesia vs Asian Median Female Earnings Correlation Chart
The statistical analysis conducted on geographies consisting of 215,754,485 people shows no correlation between the proportion of Immigrants from Indonesia and median female earnings in the United States with a correlation coefficient (R) of -0.020 and weighted average of $43,412. Similarly, the statistical analysis conducted on geographies consisting of 549,997,902 people shows a moderate positive correlation between the proportion of Asians and median female earnings in the United States with a correlation coefficient (R) of 0.412 and weighted average of $44,586, a difference of 2.7%.
Median Female Earnings Correlation Summary
| Measurement | Immigrants from Indonesia | Asian |
| Minimum | $8,380 | $27,791 |
| Maximum | $62,036 | $88,421 |
| Range | $53,656 | $60,630 |
| Mean | $40,096 | $48,672 |
| Median | $41,238 | $46,136 |
| Interquartile 25% (IQ1) | $33,750 | $43,055 |
| Interquartile 75% (IQ3) | $46,213 | $52,970 |
| Interquartile Range (IQR) | $12,463 | $9,915 |
| Standard Deviation (Sample) | $10,783 | $10,662 |
| Standard Deviation (Population) | $10,682 | $10,625 |
Demographics Similar to Immigrants from Indonesia and Asians by Median Female Earnings
In terms of median female earnings, the demographic groups most similar to Immigrants from Indonesia are Immigrants from Serbia ($43,385, a difference of 0.060%), Bolivian ($43,445, a difference of 0.070%), Immigrants from Bolivia ($43,467, a difference of 0.13%), Immigrants from Europe ($43,523, a difference of 0.26%), and Immigrants from Czechoslovakia ($43,571, a difference of 0.37%). Similarly, the demographic groups most similar to Asians are Immigrants from Belgium ($44,587, a difference of 0.0%), Immigrants from France ($44,541, a difference of 0.10%), Immigrants from Northern Europe ($44,366, a difference of 0.50%), Immigrants from Asia ($44,198, a difference of 0.88%), and Russian ($44,169, a difference of 0.94%).
| Demographics | Rating | Rank | Median Female Earnings |
| Immigrants | Belgium | 100.0 /100 | #29 | Exceptional $44,587 |
| Asians | 100.0 /100 | #30 | Exceptional $44,586 |
| Immigrants | France | 100.0 /100 | #31 | Exceptional $44,541 |
| Immigrants | Northern Europe | 100.0 /100 | #32 | Exceptional $44,366 |
| Immigrants | Asia | 100.0 /100 | #33 | Exceptional $44,198 |
| Russians | 100.0 /100 | #34 | Exceptional $44,169 |
| Immigrants | Sri Lanka | 100.0 /100 | #35 | Exceptional $44,161 |
| Immigrants | Turkey | 100.0 /100 | #36 | Exceptional $44,066 |
| Immigrants | Switzerland | 100.0 /100 | #37 | Exceptional $43,996 |
| Latvians | 100.0 /100 | #38 | Exceptional $43,941 |
| Israelis | 100.0 /100 | #39 | Exceptional $43,852 |
| Immigrants | Malaysia | 100.0 /100 | #40 | Exceptional $43,835 |
| Bhutanese | 100.0 /100 | #41 | Exceptional $43,648 |
| Immigrants | Denmark | 100.0 /100 | #42 | Exceptional $43,646 |
| Bulgarians | 100.0 /100 | #43 | Exceptional $43,638 |
| Immigrants | Czechoslovakia | 100.0 /100 | #44 | Exceptional $43,571 |
| Immigrants | Europe | 100.0 /100 | #45 | Exceptional $43,523 |
| Immigrants | Bolivia | 100.0 /100 | #46 | Exceptional $43,467 |
| Bolivians | 100.0 /100 | #47 | Exceptional $43,445 |
| Immigrants | Indonesia | 100.0 /100 | #48 | Exceptional $43,412 |
| Immigrants | Serbia | 100.0 /100 | #49 | Exceptional $43,385 |