Immigrants from Taiwan vs Syrian Median Household Income
COMPARE
Immigrants from Taiwan
Syrian
Median Household Income
Median Household Income Comparison
Immigrants from Taiwan
Syrians
$116,460
MEDIAN HOUSEHOLD INCOME
100.0/ 100
METRIC RATING
1st/ 347
METRIC RANK
$89,830
MEDIAN HOUSEHOLD INCOME
95.4/ 100
METRIC RATING
118th/ 347
METRIC RANK
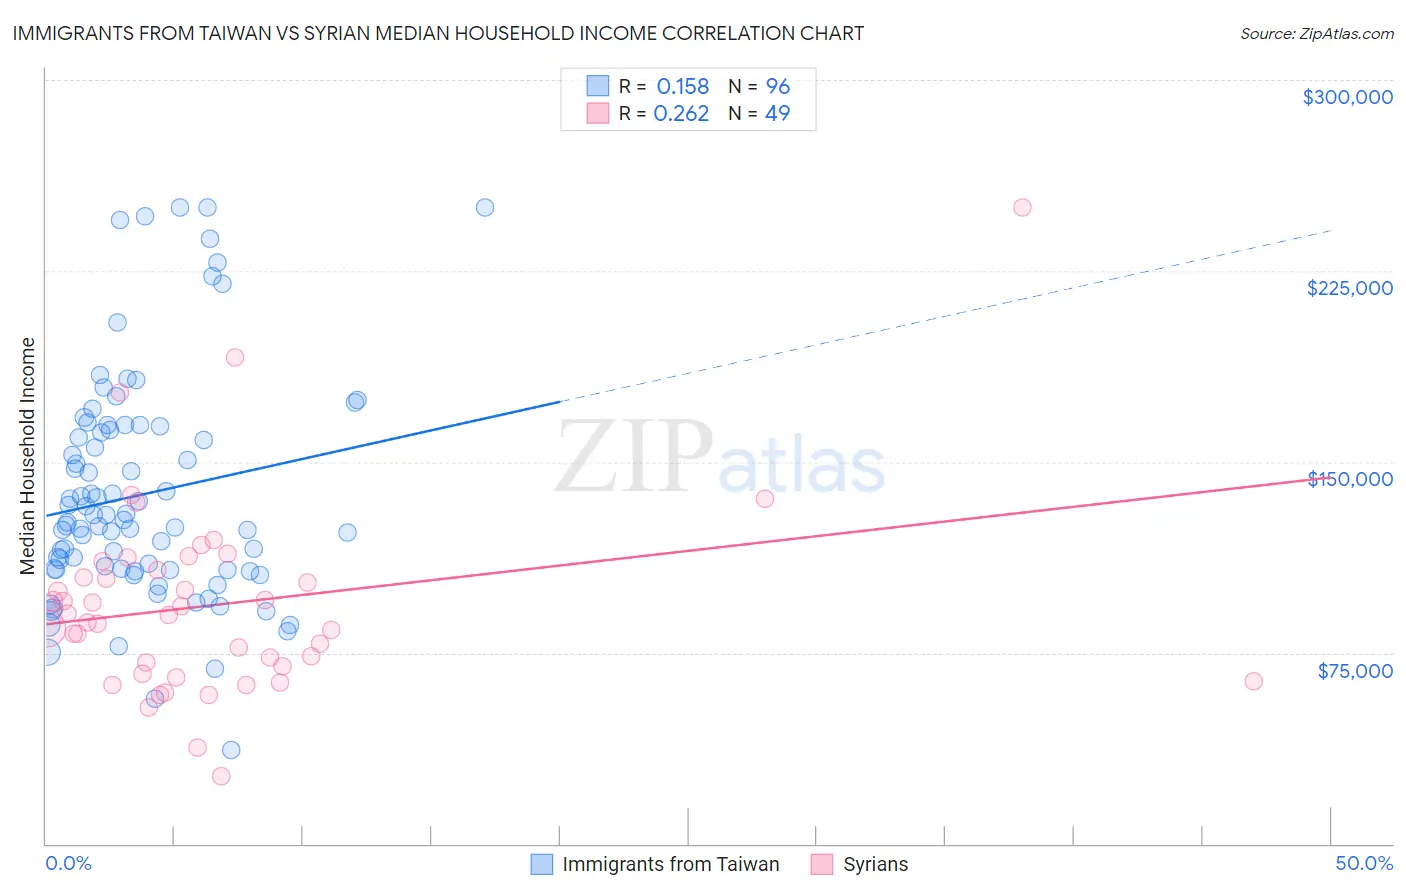
Immigrants from Taiwan vs Syrian Median Household Income Correlation Chart
The statistical analysis conducted on geographies consisting of 298,086,025 people shows a poor positive correlation between the proportion of Immigrants from Taiwan and median household income in the United States with a correlation coefficient (R) of 0.158 and weighted average of $116,460. Similarly, the statistical analysis conducted on geographies consisting of 266,119,923 people shows a weak positive correlation between the proportion of Syrians and median household income in the United States with a correlation coefficient (R) of 0.262 and weighted average of $89,830, a difference of 29.6%.
Median Household Income Correlation Summary
| Measurement | Immigrants from Taiwan | Syrian |
| Minimum | $37,017 | $26,364 |
| Maximum | $250,001 | $250,001 |
| Range | $212,984 | $223,637 |
| Mean | $137,283 | $94,106 |
| Median | $126,701 | $89,903 |
| Interquartile 25% (IQ1) | $107,640 | $68,162 |
| Interquartile 75% (IQ3) | $163,259 | $109,343 |
| Interquartile Range (IQR) | $55,619 | $41,181 |
| Standard Deviation (Sample) | $44,785 | $38,336 |
| Standard Deviation (Population) | $44,551 | $37,943 |
Similar Demographics by Median Household Income
Demographics Similar to Immigrants from Taiwan by Median Household Income
In terms of median household income, the demographic groups most similar to Immigrants from Taiwan are Filipino ($115,509, a difference of 0.82%), Immigrants from India ($113,009, a difference of 3.0%), Immigrants from Hong Kong ($111,519, a difference of 4.4%), Thai ($110,648, a difference of 5.2%), and Immigrants from Singapore ($110,428, a difference of 5.5%).
| Demographics | Rating | Rank | Median Household Income |
| Immigrants | Taiwan | 100.0 /100 | #1 | Exceptional $116,460 |
| Filipinos | 100.0 /100 | #2 | Exceptional $115,509 |
| Immigrants | India | 100.0 /100 | #3 | Exceptional $113,009 |
| Immigrants | Hong Kong | 100.0 /100 | #4 | Exceptional $111,519 |
| Thais | 100.0 /100 | #5 | Exceptional $110,648 |
| Immigrants | Singapore | 100.0 /100 | #6 | Exceptional $110,428 |
| Iranians | 100.0 /100 | #7 | Exceptional $109,835 |
| Immigrants | Iran | 100.0 /100 | #8 | Exceptional $108,055 |
| Okinawans | 100.0 /100 | #9 | Exceptional $106,624 |
| Immigrants | South Central Asia | 100.0 /100 | #10 | Exceptional $106,057 |
| Immigrants | China | 100.0 /100 | #11 | Exceptional $105,335 |
| Indians (Asian) | 100.0 /100 | #12 | Exceptional $105,262 |
| Immigrants | Eastern Asia | 100.0 /100 | #13 | Exceptional $104,796 |
| Immigrants | Ireland | 100.0 /100 | #14 | Exceptional $104,692 |
| Immigrants | Israel | 100.0 /100 | #15 | Exceptional $104,090 |
Demographics Similar to Syrians by Median Household Income
In terms of median household income, the demographic groups most similar to Syrians are Taiwanese ($89,900, a difference of 0.080%), Native Hawaiian ($89,919, a difference of 0.10%), Albanian ($89,744, a difference of 0.10%), Immigrants from North Macedonia ($89,741, a difference of 0.10%), and Immigrants from Western Asia ($90,005, a difference of 0.19%).
| Demographics | Rating | Rank | Median Household Income |
| Immigrants | Poland | 97.1 /100 | #111 | Exceptional $90,549 |
| Northern Europeans | 96.9 /100 | #112 | Exceptional $90,446 |
| Peruvians | 96.5 /100 | #113 | Exceptional $90,261 |
| Immigrants | Northern Africa | 95.9 /100 | #114 | Exceptional $90,026 |
| Immigrants | Western Asia | 95.9 /100 | #115 | Exceptional $90,005 |
| Native Hawaiians | 95.7 /100 | #116 | Exceptional $89,919 |
| Taiwanese | 95.6 /100 | #117 | Exceptional $89,900 |
| Syrians | 95.4 /100 | #118 | Exceptional $89,830 |
| Albanians | 95.2 /100 | #119 | Exceptional $89,744 |
| Immigrants | North Macedonia | 95.2 /100 | #120 | Exceptional $89,741 |
| Ethiopians | 94.9 /100 | #121 | Exceptional $89,640 |
| Pakistanis | 94.8 /100 | #122 | Exceptional $89,638 |
| Immigrants | Zimbabwe | 94.4 /100 | #123 | Exceptional $89,496 |
| Immigrants | Jordan | 94.1 /100 | #124 | Exceptional $89,412 |
| Immigrants | Kuwait | 93.5 /100 | #125 | Exceptional $89,263 |