Austrian vs Immigrants from England Householder Income Over 65 years
COMPARE
Austrian
Immigrants from England
Householder Income Over 65 years
Householder Income Over 65 years Comparison
Austrians
Immigrants from England
$64,470
HOUSEHOLDER INCOME OVER 65 YEARS
97.5/ 100
METRIC RATING
87th/ 347
METRIC RANK
$65,715
HOUSEHOLDER INCOME OVER 65 YEARS
99.3/ 100
METRIC RATING
65th/ 347
METRIC RANK
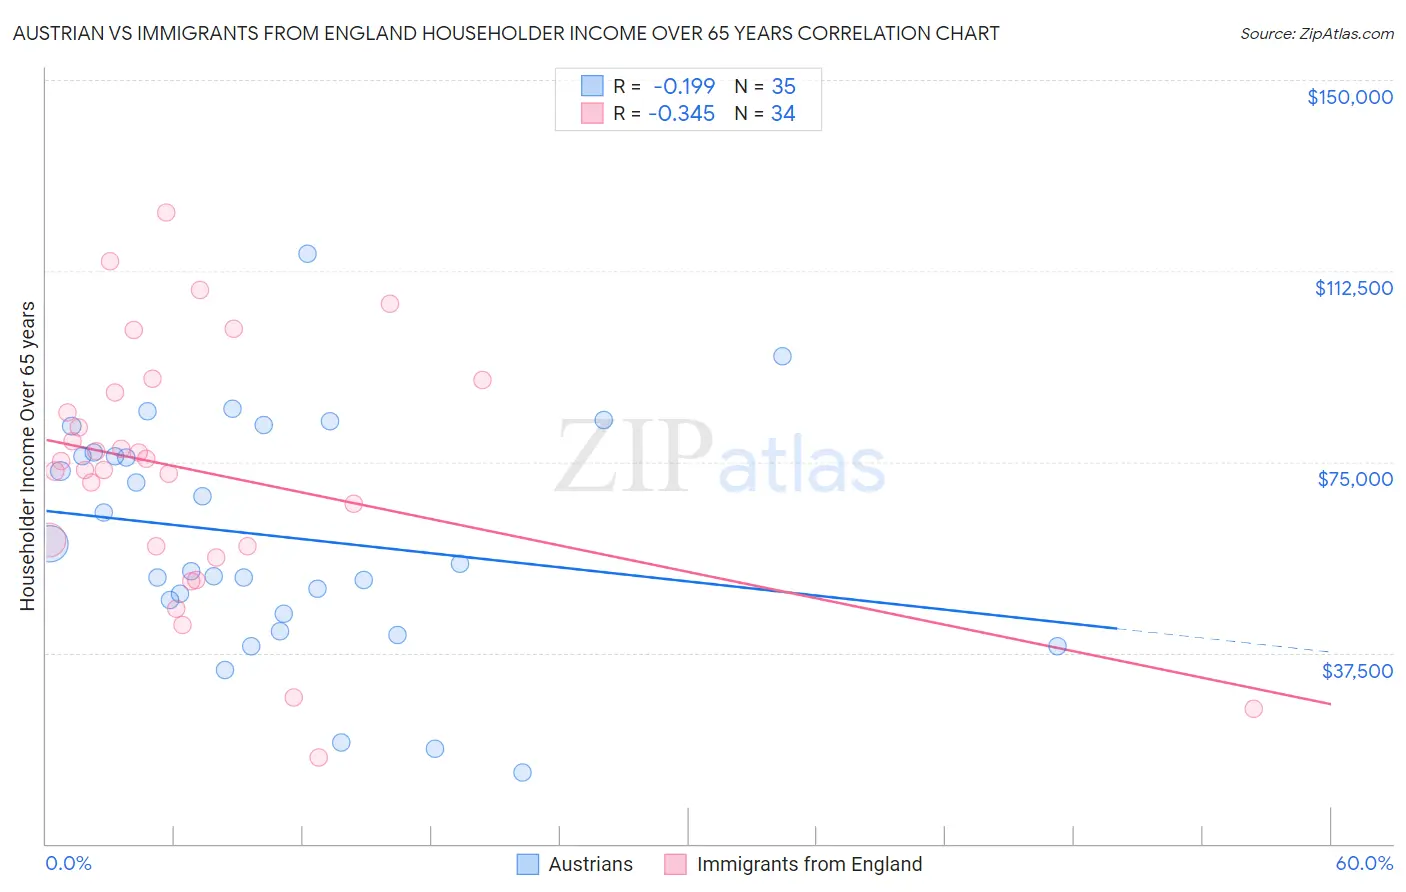
Austrian vs Immigrants from England Householder Income Over 65 years Correlation Chart
The statistical analysis conducted on geographies consisting of 450,415,389 people shows a poor negative correlation between the proportion of Austrians and household income with householder over the age of 65 in the United States with a correlation coefficient (R) of -0.199 and weighted average of $64,470. Similarly, the statistical analysis conducted on geographies consisting of 391,074,027 people shows a mild negative correlation between the proportion of Immigrants from England and household income with householder over the age of 65 in the United States with a correlation coefficient (R) of -0.345 and weighted average of $65,715, a difference of 1.9%.
Householder Income Over 65 years Correlation Summary
| Measurement | Austrian | Immigrants from England |
| Minimum | $14,097 | $16,875 |
| Maximum | $115,981 | $124,064 |
| Range | $101,884 | $107,189 |
| Mean | $60,313 | $72,987 |
| Median | $55,000 | $74,315 |
| Interquartile 25% (IQ1) | $45,290 | $58,438 |
| Interquartile 75% (IQ3) | $76,898 | $88,575 |
| Interquartile Range (IQR) | $31,609 | $30,137 |
| Standard Deviation (Sample) | $22,833 | $24,739 |
| Standard Deviation (Population) | $22,504 | $24,372 |
Similar Demographics by Householder Income Over 65 years
Demographics Similar to Austrians by Householder Income Over 65 years
In terms of householder income over 65 years, the demographic groups most similar to Austrians are Immigrants from Romania ($64,462, a difference of 0.010%), Paraguayan ($64,443, a difference of 0.040%), Immigrants from Kuwait ($64,433, a difference of 0.060%), Immigrants from Russia ($64,512, a difference of 0.070%), and Immigrants from Lebanon ($64,521, a difference of 0.080%).
| Demographics | Rating | Rank | Householder Income Over 65 years |
| Immigrants | North America | 98.3 /100 | #80 | Exceptional $64,856 |
| Immigrants | Europe | 98.3 /100 | #81 | Exceptional $64,828 |
| Immigrants | Fiji | 98.2 /100 | #82 | Exceptional $64,795 |
| Northern Europeans | 97.9 /100 | #83 | Exceptional $64,658 |
| Immigrants | Greece | 97.9 /100 | #84 | Exceptional $64,636 |
| Immigrants | Lebanon | 97.6 /100 | #85 | Exceptional $64,521 |
| Immigrants | Russia | 97.6 /100 | #86 | Exceptional $64,512 |
| Austrians | 97.5 /100 | #87 | Exceptional $64,470 |
| Immigrants | Romania | 97.5 /100 | #88 | Exceptional $64,462 |
| Paraguayans | 97.4 /100 | #89 | Exceptional $64,443 |
| Immigrants | Kuwait | 97.4 /100 | #90 | Exceptional $64,433 |
| Immigrants | Oceania | 97.4 /100 | #91 | Exceptional $64,416 |
| Immigrants | Bulgaria | 97.3 /100 | #92 | Exceptional $64,379 |
| Jordanians | 97.1 /100 | #93 | Exceptional $64,313 |
| Immigrants | Egypt | 97.0 /100 | #94 | Exceptional $64,299 |
Demographics Similar to Immigrants from England by Householder Income Over 65 years
In terms of householder income over 65 years, the demographic groups most similar to Immigrants from England are South African ($65,652, a difference of 0.10%), Zimbabwean ($65,854, a difference of 0.21%), Marshallese ($65,874, a difference of 0.24%), Immigrants from Malaysia ($65,497, a difference of 0.33%), and Egyptian ($65,441, a difference of 0.42%).
| Demographics | Rating | Rank | Householder Income Over 65 years |
| Immigrants | Philippines | 99.6 /100 | #58 | Exceptional $66,161 |
| Immigrants | Norway | 99.5 /100 | #59 | Exceptional $66,118 |
| Immigrants | Lithuania | 99.5 /100 | #60 | Exceptional $66,087 |
| Maltese | 99.5 /100 | #61 | Exceptional $66,027 |
| Immigrants | Sierra Leone | 99.5 /100 | #62 | Exceptional $66,009 |
| Marshallese | 99.4 /100 | #63 | Exceptional $65,874 |
| Zimbabweans | 99.4 /100 | #64 | Exceptional $65,854 |
| Immigrants | England | 99.3 /100 | #65 | Exceptional $65,715 |
| South Africans | 99.3 /100 | #66 | Exceptional $65,652 |
| Immigrants | Malaysia | 99.1 /100 | #67 | Exceptional $65,497 |
| Egyptians | 99.1 /100 | #68 | Exceptional $65,441 |
| Samoans | 99.1 /100 | #69 | Exceptional $65,427 |
| Mongolians | 99.0 /100 | #70 | Exceptional $65,326 |
| Greeks | 98.9 /100 | #71 | Exceptional $65,306 |
| Argentineans | 98.9 /100 | #72 | Exceptional $65,246 |