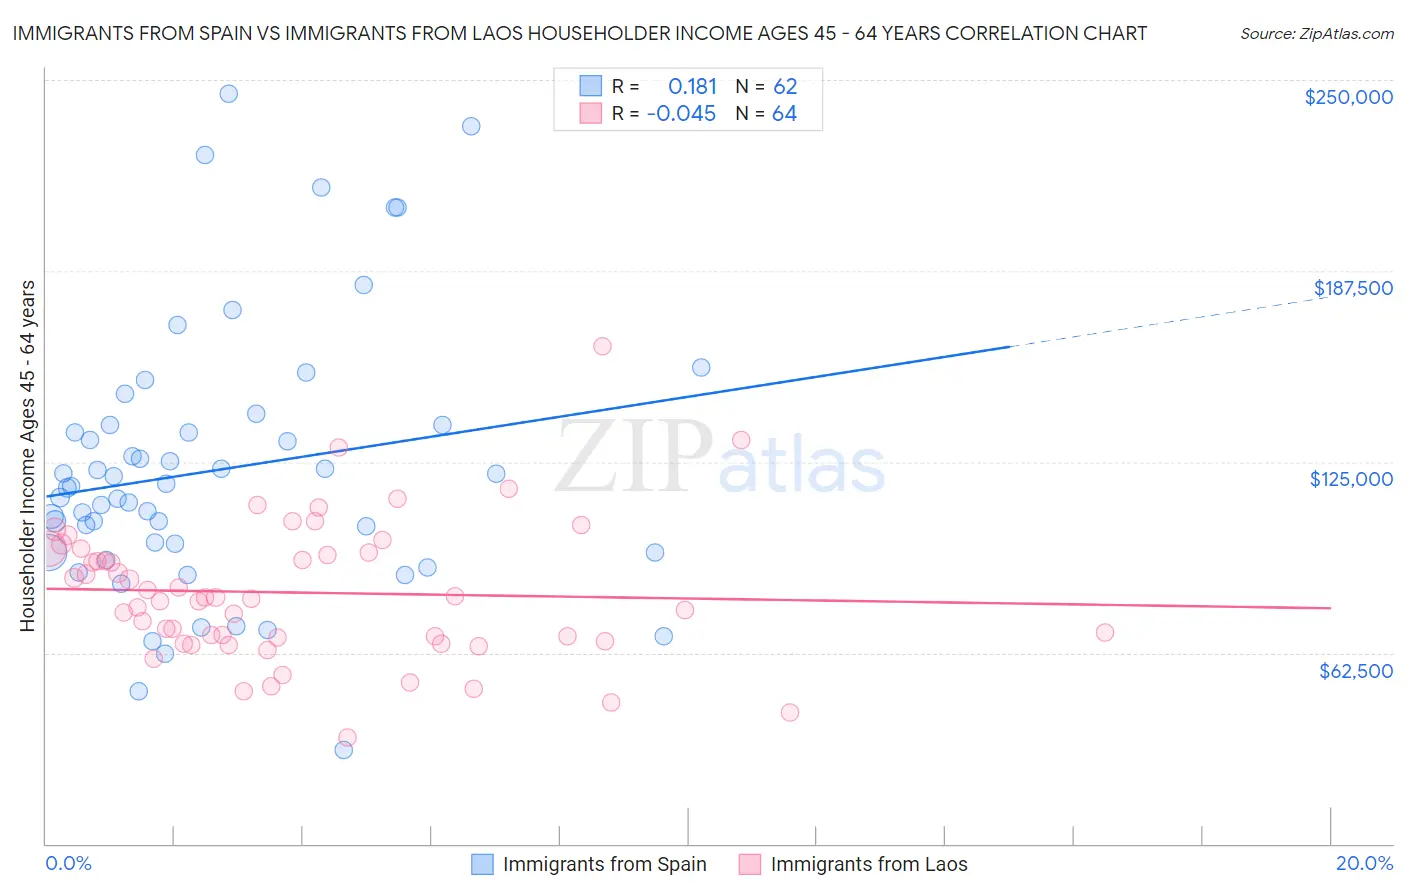
Immigrants from Spain vs Immigrants from Laos Householder Income Ages 45 - 64 years
COMPARE
Immigrants from Spain
Immigrants from Laos
Householder Income Ages 45 - 64 years
Householder Income Ages 45 - 64 years Comparison
Immigrants from Spain
Immigrants from Laos
$109,051
HOUSEHOLDER INCOME AGES 45 - 64 YEARS
98.8/ 100
METRIC RATING
83rd/ 347
METRIC RANK
$90,909
HOUSEHOLDER INCOME AGES 45 - 64 YEARS
0.9/ 100
METRIC RATING
248th/ 347
METRIC RANK
Immigrants from Spain vs Immigrants from Laos Householder Income Ages 45 - 64 years Correlation Chart
The statistical analysis conducted on geographies consisting of 239,440,989 people shows a poor positive correlation between the proportion of Immigrants from Spain and household income with householder between the ages 45 and 64 in the United States with a correlation coefficient (R) of 0.181 and weighted average of $109,051. Similarly, the statistical analysis conducted on geographies consisting of 201,374,136 people shows no correlation between the proportion of Immigrants from Laos and household income with householder between the ages 45 and 64 in the United States with a correlation coefficient (R) of -0.045 and weighted average of $90,909, a difference of 20.0%.
Householder Income Ages 45 - 64 years Correlation Summary
| Measurement | Immigrants from Spain | Immigrants from Laos |
| Minimum | $30,870 | $34,884 |
| Maximum | $245,443 | $162,951 |
| Range | $214,573 | $128,067 |
| Mean | $122,412 | $82,226 |
| Median | $116,851 | $80,326 |
| Interquartile 25% (IQ1) | $95,313 | $66,826 |
| Interquartile 75% (IQ3) | $137,063 | $95,891 |
| Interquartile Range (IQR) | $41,750 | $29,064 |
| Standard Deviation (Sample) | $44,097 | $22,939 |
| Standard Deviation (Population) | $43,740 | $22,759 |
Similar Demographics by Householder Income Ages 45 - 64 years
Demographics Similar to Immigrants from Spain by Householder Income Ages 45 - 64 years
In terms of householder income ages 45 - 64 years, the demographic groups most similar to Immigrants from Spain are Immigrants from North America ($109,198, a difference of 0.14%), Immigrants from Western Europe ($108,824, a difference of 0.21%), Immigrants from Afghanistan ($108,785, a difference of 0.24%), Immigrants from Eastern Europe ($109,335, a difference of 0.26%), and Immigrants from Bulgaria ($109,379, a difference of 0.30%).
| Demographics | Rating | Rank | Householder Income Ages 45 - 64 years |
| Paraguayans | 99.0 /100 | #76 | Exceptional $109,447 |
| Immigrants | England | 99.0 /100 | #77 | Exceptional $109,446 |
| Immigrants | Canada | 99.0 /100 | #78 | Exceptional $109,402 |
| Immigrants | Bulgaria | 98.9 /100 | #79 | Exceptional $109,379 |
| Jordanians | 98.9 /100 | #80 | Exceptional $109,376 |
| Immigrants | Eastern Europe | 98.9 /100 | #81 | Exceptional $109,335 |
| Immigrants | North America | 98.8 /100 | #82 | Exceptional $109,198 |
| Immigrants | Spain | 98.8 /100 | #83 | Exceptional $109,051 |
| Immigrants | Western Europe | 98.6 /100 | #84 | Exceptional $108,824 |
| Immigrants | Afghanistan | 98.6 /100 | #85 | Exceptional $108,785 |
| Austrians | 98.5 /100 | #86 | Exceptional $108,692 |
| Tongans | 98.5 /100 | #87 | Exceptional $108,643 |
| Romanians | 98.5 /100 | #88 | Exceptional $108,609 |
| Ukrainians | 98.3 /100 | #89 | Exceptional $108,475 |
| Immigrants | Philippines | 98.3 /100 | #90 | Exceptional $108,471 |
Demographics Similar to Immigrants from Laos by Householder Income Ages 45 - 64 years
In terms of householder income ages 45 - 64 years, the demographic groups most similar to Immigrants from Laos are Central American ($90,951, a difference of 0.050%), Alaskan Athabascan ($90,951, a difference of 0.050%), Guyanese ($90,966, a difference of 0.060%), Mexican American Indian ($90,811, a difference of 0.11%), and Subsaharan African ($90,691, a difference of 0.24%).
| Demographics | Rating | Rank | Householder Income Ages 45 - 64 years |
| Trinidadians and Tobagonians | 1.1 /100 | #241 | Tragic $91,357 |
| Inupiat | 1.1 /100 | #242 | Tragic $91,355 |
| Immigrants | Trinidad and Tobago | 1.1 /100 | #243 | Tragic $91,347 |
| Immigrants | Middle Africa | 1.1 /100 | #244 | Tragic $91,293 |
| Guyanese | 0.9 /100 | #245 | Tragic $90,966 |
| Central Americans | 0.9 /100 | #246 | Tragic $90,951 |
| Alaskan Athabascans | 0.9 /100 | #247 | Tragic $90,951 |
| Immigrants | Laos | 0.9 /100 | #248 | Tragic $90,909 |
| Mexican American Indians | 0.8 /100 | #249 | Tragic $90,811 |
| Sub-Saharan Africans | 0.8 /100 | #250 | Tragic $90,691 |
| Americans | 0.7 /100 | #251 | Tragic $90,536 |
| Marshallese | 0.7 /100 | #252 | Tragic $90,455 |
| Barbadians | 0.6 /100 | #253 | Tragic $90,266 |
| Immigrants | Guyana | 0.6 /100 | #254 | Tragic $90,186 |
| West Indians | 0.5 /100 | #255 | Tragic $89,906 |