Immigrants from Romania vs Immigrants from Netherlands Disability Age Over 75
COMPARE
Immigrants from Romania
Immigrants from Netherlands
Disability Age Over 75
Disability Age Over 75 Comparison
Immigrants from Romania
Immigrants from Netherlands
46.0%
DISABILITY AGE OVER 75
99.3/ 100
METRIC RATING
69th/ 347
METRIC RANK
45.9%
DISABILITY AGE OVER 75
99.6/ 100
METRIC RATING
56th/ 347
METRIC RANK
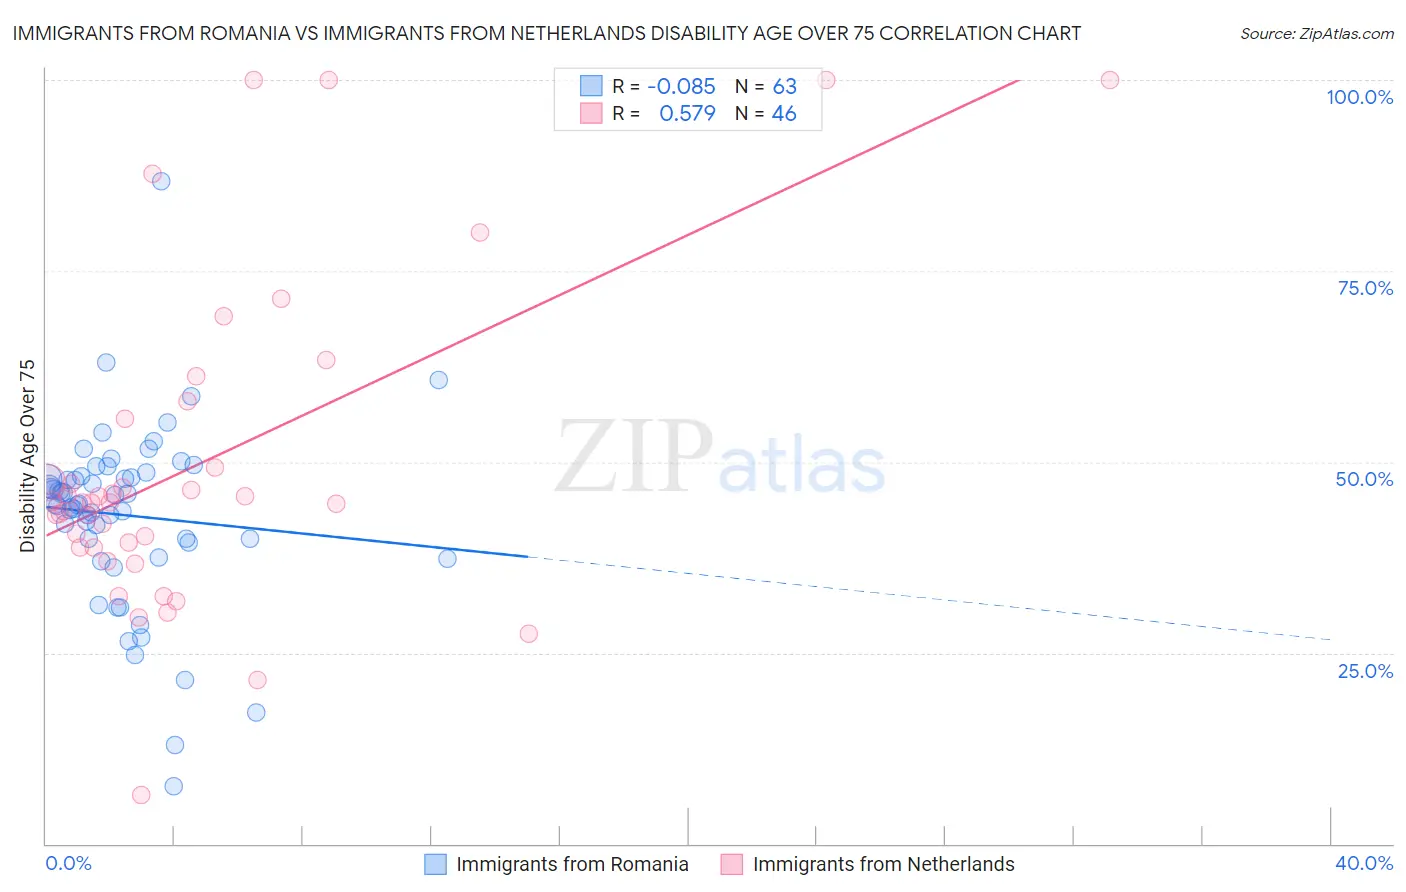
Immigrants from Romania vs Immigrants from Netherlands Disability Age Over 75 Correlation Chart
The statistical analysis conducted on geographies consisting of 256,823,298 people shows a slight negative correlation between the proportion of Immigrants from Romania and percentage of population with a disability over the age of 75 in the United States with a correlation coefficient (R) of -0.085 and weighted average of 46.0%. Similarly, the statistical analysis conducted on geographies consisting of 237,734,358 people shows a substantial positive correlation between the proportion of Immigrants from Netherlands and percentage of population with a disability over the age of 75 in the United States with a correlation coefficient (R) of 0.579 and weighted average of 45.9%, a difference of 0.29%.
Disability Age Over 75 Correlation Summary
| Measurement | Immigrants from Romania | Immigrants from Netherlands |
| Minimum | 7.5% | 6.3% |
| Maximum | 86.7% | 100.0% |
| Range | 79.2% | 93.7% |
| Mean | 43.0% | 49.7% |
| Median | 44.4% | 44.7% |
| Interquartile 25% (IQ1) | 39.5% | 38.9% |
| Interquartile 75% (IQ3) | 48.1% | 55.7% |
| Interquartile Range (IQR) | 8.6% | 16.8% |
| Standard Deviation (Sample) | 12.0% | 21.0% |
| Standard Deviation (Population) | 11.9% | 20.8% |
Demographics Similar to Immigrants from Romania and Immigrants from Netherlands by Disability Age Over 75
In terms of disability age over 75, the demographic groups most similar to Immigrants from Romania are Immigrants from South Central Asia (46.0%, a difference of 0.060%), Immigrants from Spain (46.0%, a difference of 0.090%), Jordanian (46.1%, a difference of 0.10%), Immigrants from England (46.0%, a difference of 0.12%), and Austrian (46.0%, a difference of 0.13%). Similarly, the demographic groups most similar to Immigrants from Netherlands are Immigrants from Turkey (45.9%, a difference of 0.010%), Immigrants from Israel (45.9%, a difference of 0.020%), Iranian (45.9%, a difference of 0.020%), Immigrants from Europe (45.9%, a difference of 0.020%), and Immigrants from Argentina (45.9%, a difference of 0.050%).
| Demographics | Rating | Rank | Disability Age Over 75 |
| Immigrants | France | 99.7 /100 | #52 | Exceptional 45.8% |
| Immigrants | Italy | 99.7 /100 | #53 | Exceptional 45.8% |
| Slovaks | 99.6 /100 | #54 | Exceptional 45.8% |
| Maltese | 99.6 /100 | #55 | Exceptional 45.8% |
| Immigrants | Netherlands | 99.6 /100 | #56 | Exceptional 45.9% |
| Immigrants | Turkey | 99.6 /100 | #57 | Exceptional 45.9% |
| Immigrants | Israel | 99.6 /100 | #58 | Exceptional 45.9% |
| Iranians | 99.6 /100 | #59 | Exceptional 45.9% |
| Immigrants | Europe | 99.6 /100 | #60 | Exceptional 45.9% |
| Immigrants | Argentina | 99.6 /100 | #61 | Exceptional 45.9% |
| Burmese | 99.5 /100 | #62 | Exceptional 45.9% |
| Immigrants | Norway | 99.5 /100 | #63 | Exceptional 45.9% |
| Immigrants | North Macedonia | 99.5 /100 | #64 | Exceptional 45.9% |
| Austrians | 99.5 /100 | #65 | Exceptional 46.0% |
| Immigrants | England | 99.5 /100 | #66 | Exceptional 46.0% |
| Immigrants | Spain | 99.4 /100 | #67 | Exceptional 46.0% |
| Immigrants | South Central Asia | 99.4 /100 | #68 | Exceptional 46.0% |
| Immigrants | Romania | 99.3 /100 | #69 | Exceptional 46.0% |
| Jordanians | 99.2 /100 | #70 | Exceptional 46.1% |
| Immigrants | Sri Lanka | 99.2 /100 | #71 | Exceptional 46.1% |
| Immigrants | Hungary | 99.1 /100 | #72 | Exceptional 46.1% |