Immigrants from Peru vs Tongan Householder Income Under 25 years

COMPARE

Immigrants from Peru
Race
Ancestry
AfghanAfricanAlaska NativeAlaskan AthabascanAlbanianAleutAlsatianAmericanApacheArabArapahoArgentineanArmenianAssyrian/Chaldean/SyriacAustralianAustrianBahamianBangladeshiBarbadianBasqueBelgianBelizeanBermudanBhutaneseBlackfeetBolivianBrazilianBritishBritish West IndianBulgarianBurmeseCajunCambodianCanadianCape VerdeanCarpatho RusynCelticCentral AmericanCentral American IndianCherokeeCheyenneChickasawChileanChineseChippewaChoctawColombianColvilleComancheCosta RicanCreeCreekCroatianCrowCubanCypriotCzechCzechoslovakianDanishDelawareDominicanDutchDutch West IndianEastern EuropeanEcuadorianEgyptianEnglishEstonianEthiopianEuropeanFijianFilipinoFinnishFrenchFrench American IndianFrench CanadianGermanGerman RussianGhanaianGreekGuamanian/ChamorroGuatemalanGuyaneseHaitianHmongHonduranHopiHoumaHungarianIcelanderIndian (Asian)IndonesianInupiatIranianIraqiIrishIroquoisIsraeliItalianJamaicanJapaneseJordanianKenyanKiowaKoreanLaotianLatvianLebaneseLiberianLithuanianLumbeeLuxembourgerMacedonianMalaysianMalteseMarshalleseMenomineeMexicanMexican American IndianMongolianMoroccanNative HawaiianNavajoNepaleseNew ZealanderNicaraguanNigerianNorthern EuropeanNorwegianOkinawanOsageOttawaPaiutePakistaniPalestinianPanamanianParaguayanPennsylvania GermanPeruvianPimaPolishPortuguesePotawatomiPuebloPuerto RicanPuget Sound SalishRomanianRussianSalvadoranSamoanScandinavianScotch-IrishScottishSeminoleSenegaleseSerbianShoshoneSierra LeoneanSiouxSlavicSlovakSloveneSomaliSouth AfricanSouth AmericanSouth American IndianSoviet UnionSpaniardSpanishSpanish AmericanSpanish American IndianSri LankanSubsaharan AfricanSudaneseSwedishSwissSyrianTaiwaneseThaiTlingit-HaidaTohono O'OdhamTrinidadian and TobagonianTsimshianTurkishU.S. Virgin IslanderUgandanUkrainianUruguayanUteVenezuelanVietnameseWelshWest IndianYakamaYaquiYugoslavianYumanYup'ikZimbabwean
Immigration
NonimmigrantsImmigrantsAfghanistanAfricaAlbaniaArgentinaArmeniaAsiaAustraliaAustriaBahamasBangladeshBarbadosBelarusBelgiumBelizeBoliviaBosnia and HerzegovinaBrazilBulgariaBurma/MyanmarCabo VerdeCambodiaCameroonCanadaCaribbeanCentral AmericaChileChinaColombiaCongoCosta RicaCroatiaCubaCzechoslovakiaDenmarkDominicaDominican RepublicEastern AfricaEastern AsiaEastern EuropeEcuadorEgyptEl SalvadorEnglandEritreaEthiopiaEuropeFijiFranceGermanyGhanaGreeceGrenadaGuatemalaGuyanaHaitiHondurasHong KongHungaryIndiaIndonesiaIranIraqIrelandIsraelItalyJamaicaJapanJordanKazakhstanKenyaKoreaKuwaitLaosLatin AmericaLatviaLebanonLiberiaLithuaniaMalaysiaMexicoMicronesiaMiddle AfricaMoldovaMoroccoNepalNetherlandsNicaraguaNigeriaNorth AmericaNorth MacedoniaNorthern AfricaNorthern EuropeNorwayOceaniaPakistanPanamaPeruPhilippinesPolandPortugalRomaniaRussiaSaudi ArabiaScotlandSenegalSerbiaSierra LeoneSingaporeSomaliaSouth AfricaSouth AmericaSouth Central AsiaSouth Eastern AsiaSouthern EuropeSpainSri LankaSt. Vincent and the GrenadinesSudanSwedenSwitzerlandSyriaTaiwanThailandTrinidad and TobagoTurkeyUgandaUkraineUruguayUzbekistanVenezuelaVietnamWest IndiesWestern AfricaWestern AsiaWestern EuropeYemenZaireZimbabweAzores
Tongan
Race
Ancestry
AfghanAfricanAlaska NativeAlaskan AthabascanAlbanianAleutAlsatianAmericanApacheArabArapahoArgentineanArmenianAssyrian/Chaldean/SyriacAustralianAustrianBahamianBangladeshiBarbadianBasqueBelgianBelizeanBermudanBhutaneseBlackfeetBolivianBrazilianBritishBritish West IndianBulgarianBurmeseCajunCambodianCanadianCape VerdeanCarpatho RusynCelticCentral AmericanCentral American IndianCherokeeCheyenneChickasawChileanChineseChippewaChoctawColombianColvilleComancheCosta RicanCreeCreekCroatianCrowCubanCypriotCzechCzechoslovakianDanishDelawareDominicanDutchDutch West IndianEastern EuropeanEcuadorianEgyptianEnglishEstonianEthiopianEuropeanFijianFilipinoFinnishFrenchFrench American IndianFrench CanadianGermanGerman RussianGhanaianGreekGuamanian/ChamorroGuatemalanGuyaneseHaitianHmongHonduranHopiHoumaHungarianIcelanderIndian (Asian)IndonesianInupiatIranianIraqiIrishIroquoisIsraeliItalianJamaicanJapaneseJordanianKenyanKiowaKoreanLaotianLatvianLebaneseLiberianLithuanianLumbeeLuxembourgerMacedonianMalaysianMalteseMarshalleseMenomineeMexicanMexican American IndianMongolianMoroccanNative HawaiianNavajoNepaleseNew ZealanderNicaraguanNigerianNorthern EuropeanNorwegianOkinawanOsageOttawaPaiutePakistaniPalestinianPanamanianParaguayanPennsylvania GermanPeruvianPimaPolishPortuguesePotawatomiPuebloPuerto RicanPuget Sound SalishRomanianRussianSalvadoranSamoanScandinavianScotch-IrishScottishSeminoleSenegaleseSerbianShoshoneSierra LeoneanSiouxSlavicSlovakSloveneSomaliSouth AfricanSouth AmericanSouth American IndianSoviet UnionSpaniardSpanishSpanish AmericanSpanish American IndianSri LankanSubsaharan AfricanSudaneseSwedishSwissSyrianTaiwaneseThaiTlingit-HaidaTohono O'OdhamTonganTrinidadian and TobagonianTsimshianTurkishU.S. Virgin IslanderUgandanUkrainianUruguayanUteVenezuelanVietnameseWelshWest IndianYakamaYaquiYugoslavianYumanYup'ikZimbabwean
Immigration
NonimmigrantsImmigrantsAfghanistanAfricaAlbaniaArgentinaArmeniaAsiaAustraliaAustriaBahamasBangladeshBarbadosBelarusBelgiumBelizeBoliviaBosnia and HerzegovinaBrazilBulgariaBurma/MyanmarCabo VerdeCambodiaCameroonCanadaCaribbeanCentral AmericaChileChinaColombiaCongoCosta RicaCroatiaCubaCzechoslovakiaDenmarkDominicaDominican RepublicEastern AfricaEastern AsiaEastern EuropeEcuadorEgyptEl SalvadorEnglandEritreaEthiopiaEuropeFijiFranceGermanyGhanaGreeceGrenadaGuatemalaGuyanaHaitiHondurasHong KongHungaryIndiaIndonesiaIranIraqIrelandIsraelItalyJamaicaJapanJordanKazakhstanKenyaKoreaKuwaitLaosLatin AmericaLatviaLebanonLiberiaLithuaniaMalaysiaMexicoMicronesiaMiddle AfricaMoldovaMoroccoNepalNetherlandsNicaraguaNigeriaNorth AmericaNorth MacedoniaNorthern AfricaNorthern EuropeNorwayOceaniaPakistanPanamaPhilippinesPolandPortugalRomaniaRussiaSaudi ArabiaScotlandSenegalSerbiaSierra LeoneSingaporeSomaliaSouth AfricaSouth AmericaSouth Central AsiaSouth Eastern AsiaSouthern EuropeSpainSri LankaSt. Vincent and the GrenadinesSudanSwedenSwitzerlandSyriaTaiwanThailandTrinidad and TobagoTurkeyUgandaUkraineUruguayUzbekistanVenezuelaVietnamWest IndiesWestern AfricaWestern AsiaWestern EuropeYemenZaireZimbabweAzores
Householder Income Under 25 years
Income
Poverty
Unemployment
Labor Participation
Family Structure
Vehicle Availability
Education Level
Disability

Householder Income Under 25 years Comparison

Immigrants from Peru

Tongans

Exceptional
Exceptional
$56,384
HOUSEHOLDER INCOME UNDER 25 YEARS
100.0/ 100
METRIC RATING
28th/ 347
METRIC RANK
$56,972
HOUSEHOLDER INCOME UNDER 25 YEARS
100.0/ 100
METRIC RATING
23rd/ 347
METRIC RANK

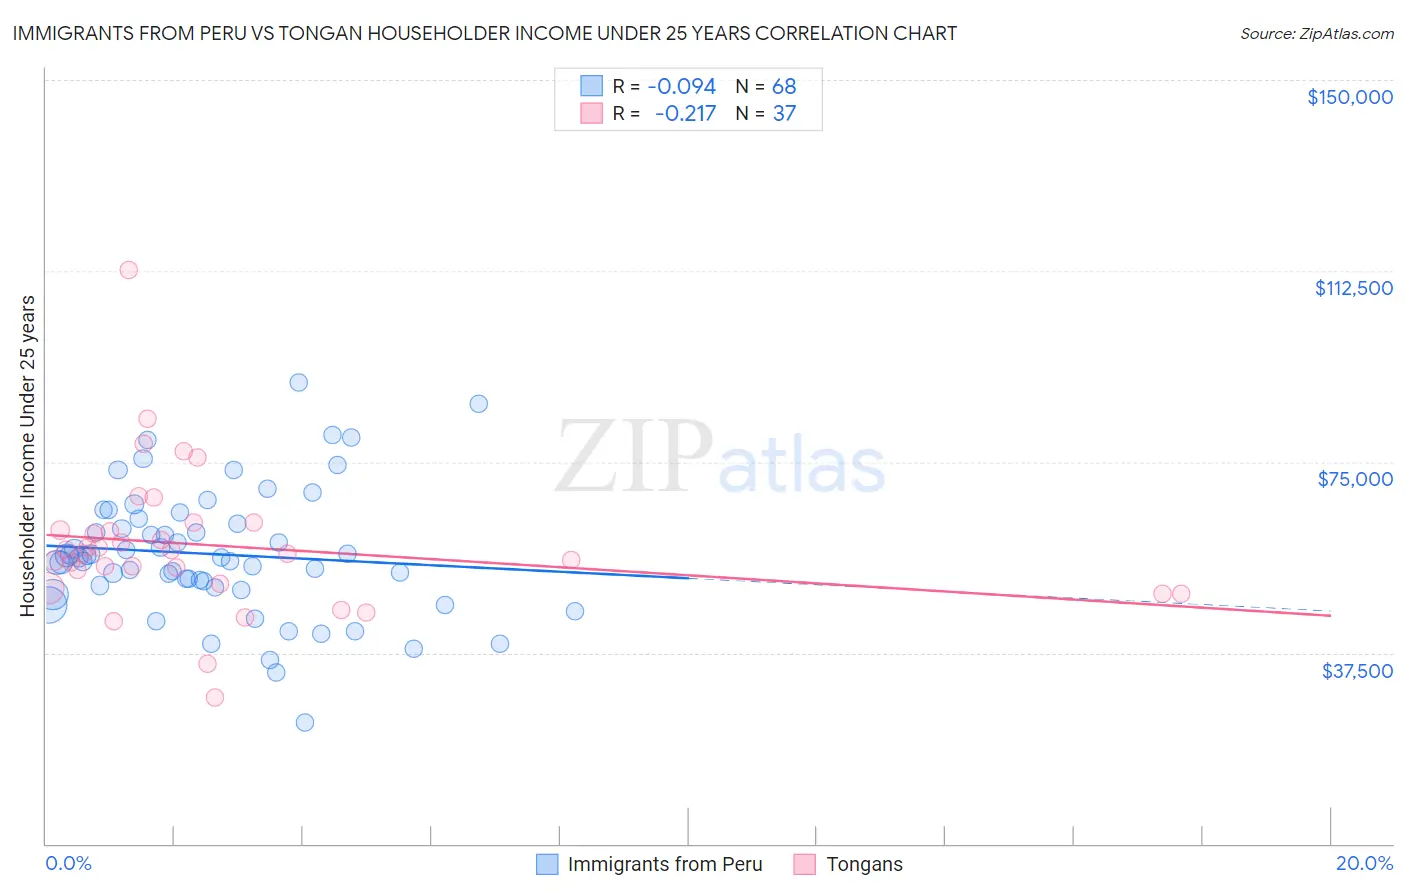
Immigrants from Peru vs Tongan Householder Income Under 25 years Correlation Chart

The statistical analysis conducted on geographies consisting of 281,649,293 people shows a slight negative correlation between the proportion of Immigrants from Peru and household income with householder under the age of 25 in the United States with a correlation coefficient (R) of -0.094 and weighted average of $56,384. Similarly, the statistical analysis conducted on geographies consisting of 96,005,188 people shows a weak negative correlation between the proportion of Tongans and household income with householder under the age of 25 in the United States with a correlation coefficient (R) of -0.217 and weighted average of $56,972, a difference of 1.0%.
Immigrants from Peru vs Tongan Householder Income Under 25 years

Householder Income Under 25 years Correlation Summary

MeasurementImmigrants from PeruTongan
Minimum$23,750$28,696
Maximum$90,496$112,736
Range$66,746$84,040
Mean$56,893$58,510
Median$56,174$56,941
Interquartile 25% (IQ1)$50,499$50,618
Interquartile 75% (IQ3)$63,350$62,342
Interquartile Range (IQR)$12,851$11,724
Standard Deviation (Sample)$12,520$14,382
Standard Deviation (Population)$12,427$14,186

Demographics Similar to Immigrants from Peru and Tongans by Householder Income Under 25 years

In terms of householder income under 25 years, the demographic groups most similar to Immigrants from Peru are Immigrants from Asia ($56,379, a difference of 0.010%), Immigrants from North Macedonia ($56,503, a difference of 0.21%), Immigrants from Moldova ($56,168, a difference of 0.38%), Vietnamese ($56,127, a difference of 0.46%), and Immigrants from Australia ($56,660, a difference of 0.49%). Similarly, the demographic groups most similar to Tongans are Asian ($57,003, a difference of 0.050%), Bhutanese ($57,078, a difference of 0.18%), Immigrants from Ireland ($57,075, a difference of 0.18%), Immigrants from Fiji ($57,074, a difference of 0.18%), and Immigrants from Singapore ($56,835, a difference of 0.24%).
DemographicsRating | RankHouseholder Income Under 25 years
Koreans
100.0
/100
|
#15
Exceptional
$57,730
Immigrants | Afghanistan
100.0
/100
|
#16
Exceptional
$57,478
Sierra Leoneans
100.0
/100
|
#17
Exceptional
$57,272
Immigrants | Eastern Asia
100.0
/100
|
#18
Exceptional
$57,123
Bhutanese
100.0
/100
|
#19
Exceptional
$57,078
Immigrants | Ireland
100.0
/100
|
#20
Exceptional
$57,075
Immigrants | Fiji
100.0
/100
|
#21
Exceptional
$57,074
Asians
100.0
/100
|
#22
Exceptional
$57,003
Tongans
100.0
/100
|
#23
Exceptional
$56,972
Immigrants | Singapore
100.0
/100
|
#24
Exceptional
$56,835
Immigrants | Pakistan
100.0
/100
|
#25
Exceptional
$56,789
Immigrants | Australia
100.0
/100
|
#26
Exceptional
$56,660
Immigrants | North Macedonia
100.0
/100
|
#27
Exceptional
$56,503
Immigrants | Peru
100.0
/100
|
#28
Exceptional
$56,384
Immigrants | Asia
100.0
/100
|
#29
Exceptional
$56,379
Immigrants | Moldova
100.0
/100
|
#30
Exceptional
$56,168
Vietnamese
100.0
/100
|
#31
Exceptional
$56,127
Peruvians
100.0
/100
|
#32
Exceptional
$56,052
Inupiat
100.0
/100
|
#33
Exceptional
$55,935
Immigrants | Japan
100.0
/100
|
#34
Exceptional
$55,932
Tlingit-Haida
100.0
/100
|
#35
Exceptional
$55,914