Immigrants from Peru vs Tongan 8th Grade
COMPARE
Immigrants from Peru
Tongan
8th Grade
8th Grade Comparison
Immigrants from Peru
Tongans
94.5%
8TH GRADE
0.0/ 100
METRIC RATING
286th/ 347
METRIC RANK
95.1%
8TH GRADE
1.7/ 100
METRIC RATING
242nd/ 347
METRIC RANK
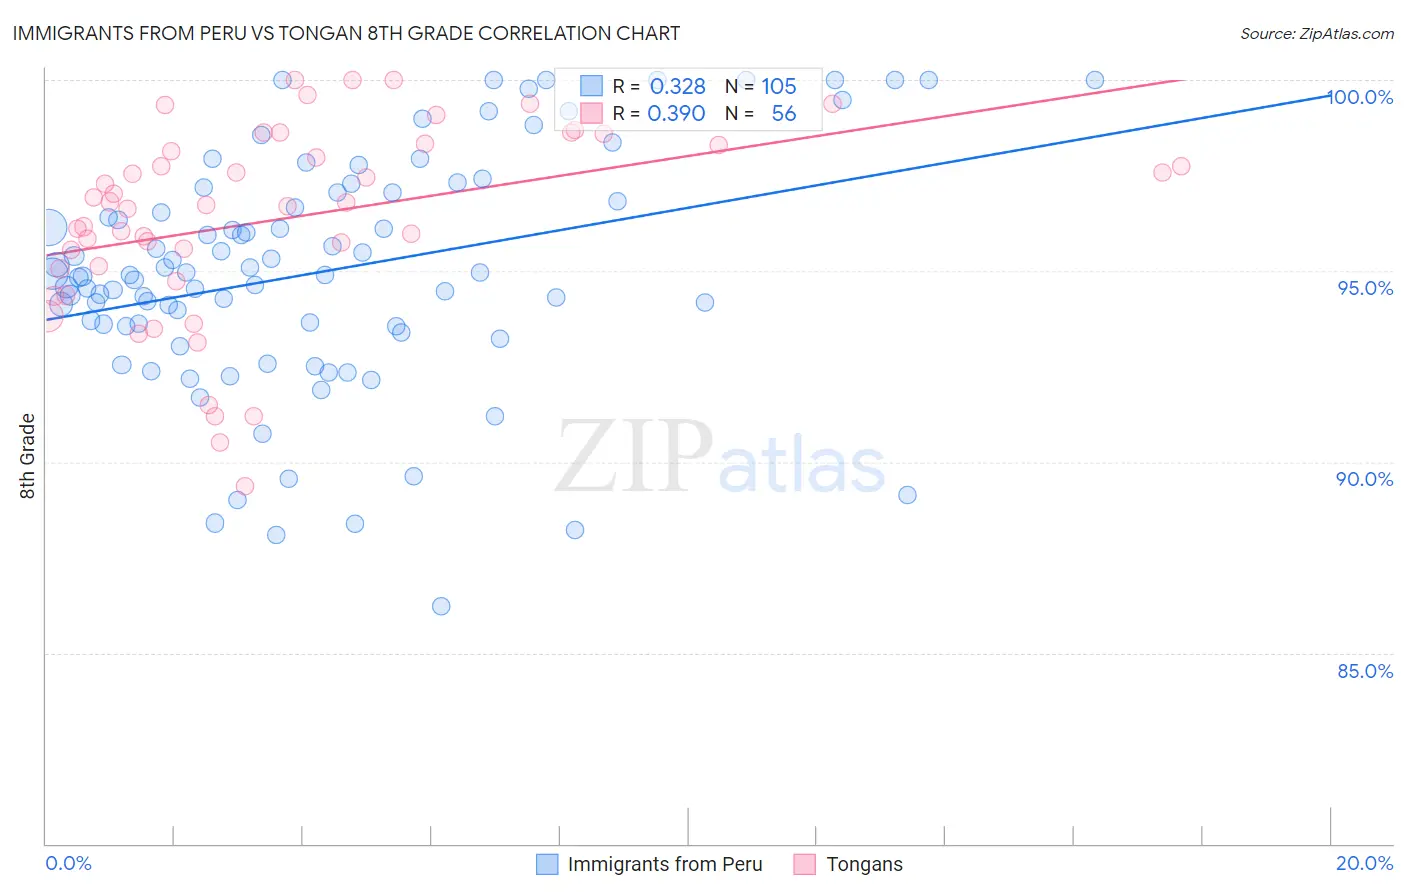
Immigrants from Peru vs Tongan 8th Grade Correlation Chart
The statistical analysis conducted on geographies consisting of 328,685,762 people shows a mild positive correlation between the proportion of Immigrants from Peru and percentage of population with at least 8th grade education in the United States with a correlation coefficient (R) of 0.328 and weighted average of 94.5%. Similarly, the statistical analysis conducted on geographies consisting of 102,873,790 people shows a mild positive correlation between the proportion of Tongans and percentage of population with at least 8th grade education in the United States with a correlation coefficient (R) of 0.390 and weighted average of 95.1%, a difference of 0.66%.
8th Grade Correlation Summary
| Measurement | Immigrants from Peru | Tongan |
| Minimum | 86.2% | 89.4% |
| Maximum | 100.0% | 100.0% |
| Range | 13.8% | 10.6% |
| Mean | 95.0% | 96.4% |
| Median | 94.9% | 96.8% |
| Interquartile 25% (IQ1) | 93.5% | 95.1% |
| Interquartile 75% (IQ3) | 97.1% | 98.3% |
| Interquartile Range (IQR) | 3.5% | 3.2% |
| Standard Deviation (Sample) | 3.1% | 2.5% |
| Standard Deviation (Population) | 3.0% | 2.5% |
Similar Demographics by 8th Grade
Demographics Similar to Immigrants from Peru by 8th Grade
In terms of 8th grade, the demographic groups most similar to Immigrants from Peru are Tohono O'odham (94.5%, a difference of 0.0%), Malaysian (94.5%, a difference of 0.030%), Immigrants from Barbados (94.5%, a difference of 0.050%), Immigrants from Philippines (94.6%, a difference of 0.080%), and Immigrants from St. Vincent and the Grenadines (94.6%, a difference of 0.090%).
| Demographics | Rating | Rank | 8th Grade |
| Immigrants | Trinidad and Tobago | 0.1 /100 | #279 | Tragic 94.6% |
| Barbadians | 0.1 /100 | #280 | Tragic 94.6% |
| Immigrants | Bolivia | 0.1 /100 | #281 | Tragic 94.6% |
| Immigrants | Eritrea | 0.1 /100 | #282 | Tragic 94.6% |
| Immigrants | St. Vincent and the Grenadines | 0.1 /100 | #283 | Tragic 94.6% |
| Immigrants | Philippines | 0.1 /100 | #284 | Tragic 94.6% |
| Immigrants | Barbados | 0.0 /100 | #285 | Tragic 94.5% |
| Immigrants | Peru | 0.0 /100 | #286 | Tragic 94.5% |
| Tohono O'odham | 0.0 /100 | #287 | Tragic 94.5% |
| Malaysians | 0.0 /100 | #288 | Tragic 94.5% |
| British West Indians | 0.0 /100 | #289 | Tragic 94.4% |
| Immigrants | West Indies | 0.0 /100 | #290 | Tragic 94.3% |
| Immigrants | Grenada | 0.0 /100 | #291 | Tragic 94.3% |
| Bangladeshis | 0.0 /100 | #292 | Tragic 94.3% |
| Yaqui | 0.0 /100 | #293 | Tragic 94.2% |
Demographics Similar to Tongans by 8th Grade
In terms of 8th grade, the demographic groups most similar to Tongans are Paiute (95.1%, a difference of 0.0%), Immigrants from Middle Africa (95.1%, a difference of 0.0%), Ethiopian (95.1%, a difference of 0.020%), South American Indian (95.1%, a difference of 0.020%), and Immigrants from Sierra Leone (95.1%, a difference of 0.030%).
| Demographics | Rating | Rank | 8th Grade |
| Nigerians | 2.9 /100 | #235 | Tragic 95.2% |
| Senegalese | 2.7 /100 | #236 | Tragic 95.2% |
| Immigrants | Africa | 2.7 /100 | #237 | Tragic 95.2% |
| Natives/Alaskans | 2.3 /100 | #238 | Tragic 95.2% |
| Immigrants | Sierra Leone | 2.1 /100 | #239 | Tragic 95.1% |
| Ethiopians | 2.0 /100 | #240 | Tragic 95.1% |
| South American Indians | 1.9 /100 | #241 | Tragic 95.1% |
| Tongans | 1.7 /100 | #242 | Tragic 95.1% |
| Paiute | 1.7 /100 | #243 | Tragic 95.1% |
| Immigrants | Middle Africa | 1.7 /100 | #244 | Tragic 95.1% |
| Jamaicans | 1.4 /100 | #245 | Tragic 95.1% |
| Somalis | 1.4 /100 | #246 | Tragic 95.1% |
| Immigrants | Senegal | 1.4 /100 | #247 | Tragic 95.1% |
| Uruguayans | 1.2 /100 | #248 | Tragic 95.1% |
| Immigrants | China | 1.1 /100 | #249 | Tragic 95.0% |