Immigrants from Eritrea vs Sri Lankan Median Earnings
COMPARE
Immigrants from Eritrea
Sri Lankan
Median Earnings
Median Earnings Comparison
Immigrants from Eritrea
Sri Lankans
$47,657
MEDIAN EARNINGS
84.8/ 100
METRIC RATING
148th/ 347
METRIC RANK
$48,040
MEDIAN EARNINGS
90.5/ 100
METRIC RATING
134th/ 347
METRIC RANK
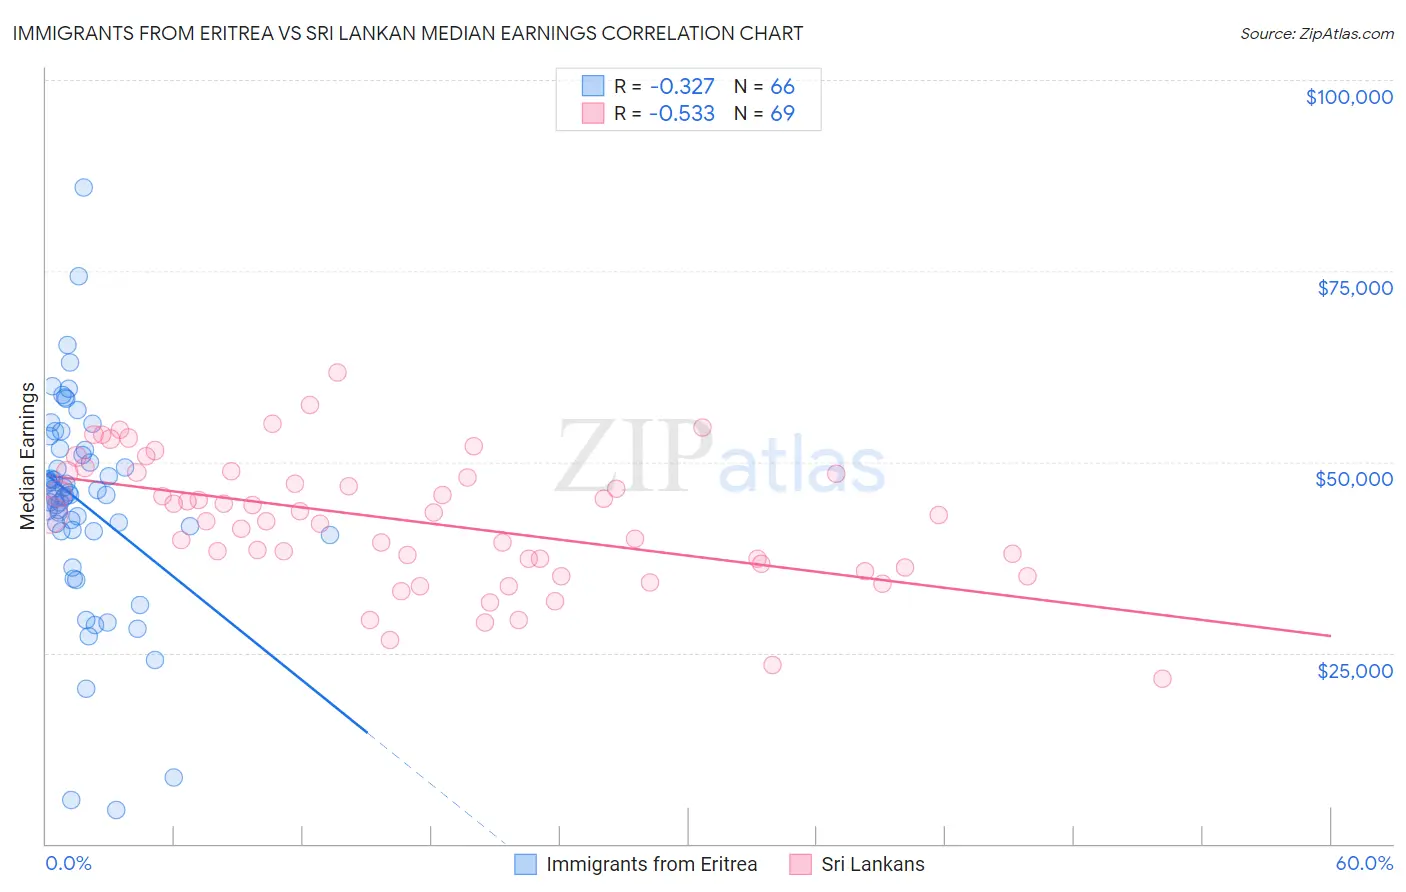
Immigrants from Eritrea vs Sri Lankan Median Earnings Correlation Chart
The statistical analysis conducted on geographies consisting of 104,854,314 people shows a mild negative correlation between the proportion of Immigrants from Eritrea and median earnings in the United States with a correlation coefficient (R) of -0.327 and weighted average of $47,657. Similarly, the statistical analysis conducted on geographies consisting of 440,583,083 people shows a substantial negative correlation between the proportion of Sri Lankans and median earnings in the United States with a correlation coefficient (R) of -0.533 and weighted average of $48,040, a difference of 0.80%.
Median Earnings Correlation Summary
| Measurement | Immigrants from Eritrea | Sri Lankan |
| Minimum | $4,426 | $21,667 |
| Maximum | $85,924 | $61,651 |
| Range | $81,498 | $39,984 |
| Mean | $44,557 | $42,190 |
| Median | $45,626 | $43,063 |
| Interquartile 25% (IQ1) | $40,964 | $36,459 |
| Interquartile 75% (IQ3) | $51,547 | $48,491 |
| Interquartile Range (IQR) | $10,583 | $12,032 |
| Standard Deviation (Sample) | $13,912 | $8,385 |
| Standard Deviation (Population) | $13,806 | $8,324 |
Demographics Similar to Immigrants from Eritrea and Sri Lankans by Median Earnings
In terms of median earnings, the demographic groups most similar to Immigrants from Eritrea are Immigrants from South Eastern Asia ($47,671, a difference of 0.030%), Luxembourger ($47,640, a difference of 0.040%), Peruvian ($47,628, a difference of 0.060%), Immigrants from Chile ($47,697, a difference of 0.080%), and Immigrants from Oceania ($47,617, a difference of 0.080%). Similarly, the demographic groups most similar to Sri Lankans are Immigrants from Uganda ($48,041, a difference of 0.0%), Portuguese ($48,032, a difference of 0.020%), Slovene ($47,995, a difference of 0.090%), Immigrants from Nepal ($47,925, a difference of 0.24%), and European ($47,915, a difference of 0.26%).
| Demographics | Rating | Rank | Median Earnings |
| Lebanese | 92.5 /100 | #131 | Exceptional $48,226 |
| British | 92.2 /100 | #132 | Exceptional $48,189 |
| Immigrants | Uganda | 90.5 /100 | #133 | Exceptional $48,041 |
| Sri Lankans | 90.5 /100 | #134 | Exceptional $48,040 |
| Portuguese | 90.4 /100 | #135 | Exceptional $48,032 |
| Slovenes | 90.0 /100 | #136 | Excellent $47,995 |
| Immigrants | Nepal | 89.0 /100 | #137 | Excellent $47,925 |
| Europeans | 88.9 /100 | #138 | Excellent $47,915 |
| Canadians | 88.8 /100 | #139 | Excellent $47,911 |
| Taiwanese | 88.7 /100 | #140 | Excellent $47,902 |
| Immigrants | Sierra Leone | 88.3 /100 | #141 | Excellent $47,875 |
| Ugandans | 88.0 /100 | #142 | Excellent $47,854 |
| Swedes | 88.0 /100 | #143 | Excellent $47,851 |
| Hungarians | 87.1 /100 | #144 | Excellent $47,795 |
| Immigrants | Saudi Arabia | 85.6 /100 | #145 | Excellent $47,704 |
| Immigrants | Chile | 85.5 /100 | #146 | Excellent $47,697 |
| Immigrants | South Eastern Asia | 85.0 /100 | #147 | Excellent $47,671 |
| Immigrants | Eritrea | 84.8 /100 | #148 | Excellent $47,657 |
| Luxembourgers | 84.5 /100 | #149 | Excellent $47,640 |
| Peruvians | 84.2 /100 | #150 | Excellent $47,628 |
| Immigrants | Oceania | 84.1 /100 | #151 | Excellent $47,617 |