Immigrants from Malaysia vs Bhutanese Median Family Income

COMPARE

Immigrants from Malaysia
Race
Ancestry
AfghanAfricanAlaska NativeAlaskan AthabascanAlbanianAleutAlsatianAmericanApacheArabArapahoArgentineanArmenianAssyrian/Chaldean/SyriacAustralianAustrianBahamianBangladeshiBarbadianBasqueBelgianBelizeanBermudanBlackfeetBolivianBrazilianBritishBritish West IndianBulgarianBurmeseCajunCambodianCanadianCape VerdeanCarpatho RusynCelticCentral AmericanCentral American IndianCherokeeCheyenneChickasawChileanChineseChippewaChoctawColombianColvilleComancheCosta RicanCreeCreekCroatianCrowCubanCypriotCzechCzechoslovakianDanishDelawareDominicanDutchDutch West IndianEastern EuropeanEcuadorianEgyptianEnglishEstonianEthiopianEuropeanFijianFilipinoFinnishFrenchFrench American IndianFrench CanadianGermanGerman RussianGhanaianGreekGuamanian/ChamorroGuatemalanGuyaneseHaitianHmongHonduranHopiHoumaHungarianIcelanderIndian (Asian)IndonesianInupiatIranianIraqiIrishIroquoisIsraeliItalianJamaicanJapaneseJordanianKenyanKiowaKoreanLaotianLatvianLebaneseLiberianLithuanianLumbeeLuxembourgerMacedonianMalaysianMalteseMarshalleseMenomineeMexicanMexican American IndianMongolianMoroccanNative HawaiianNavajoNepaleseNew ZealanderNicaraguanNigerianNorthern EuropeanNorwegianOkinawanOsageOttawaPaiutePakistaniPalestinianPanamanianParaguayanPennsylvania GermanPeruvianPimaPolishPortuguesePotawatomiPuebloPuerto RicanPuget Sound SalishRomanianRussianSalvadoranSamoanScandinavianScotch-IrishScottishSeminoleSenegaleseSerbianShoshoneSierra LeoneanSiouxSlavicSlovakSloveneSomaliSouth AfricanSouth AmericanSouth American IndianSoviet UnionSpaniardSpanishSpanish AmericanSpanish American IndianSri LankanSubsaharan AfricanSudaneseSwedishSwissSyrianTaiwaneseThaiTlingit-HaidaTohono O'OdhamTonganTrinidadian and TobagonianTsimshianTurkishU.S. Virgin IslanderUgandanUkrainianUruguayanUteVenezuelanVietnameseWelshWest IndianYakamaYaquiYugoslavianYumanYup'ikZimbabwean
Immigration
NonimmigrantsImmigrantsAfghanistanAfricaAlbaniaArgentinaArmeniaAsiaAustraliaAustriaBahamasBangladeshBarbadosBelarusBelgiumBelizeBoliviaBosnia and HerzegovinaBrazilBulgariaBurma/MyanmarCabo VerdeCambodiaCameroonCanadaCaribbeanCentral AmericaChileChinaColombiaCongoCosta RicaCroatiaCubaCzechoslovakiaDenmarkDominicaDominican RepublicEastern AfricaEastern AsiaEastern EuropeEcuadorEgyptEl SalvadorEnglandEritreaEthiopiaEuropeFijiFranceGermanyGhanaGreeceGrenadaGuatemalaGuyanaHaitiHondurasHong KongHungaryIndiaIndonesiaIranIraqIrelandIsraelItalyJamaicaJapanJordanKazakhstanKenyaKoreaKuwaitLaosLatin AmericaLatviaLebanonLiberiaLithuaniaMalaysiaMexicoMicronesiaMiddle AfricaMoldovaMoroccoNepalNetherlandsNicaraguaNigeriaNorth AmericaNorth MacedoniaNorthern AfricaNorthern EuropeNorwayOceaniaPakistanPanamaPeruPhilippinesPolandPortugalRomaniaRussiaSaudi ArabiaScotlandSenegalSerbiaSierra LeoneSingaporeSomaliaSouth AfricaSouth AmericaSouth Central AsiaSouth Eastern AsiaSouthern EuropeSpainSri LankaSt. Vincent and the GrenadinesSudanSwedenSwitzerlandSyriaTaiwanThailandTrinidad and TobagoTurkeyUgandaUkraineUruguayUzbekistanVenezuelaVietnamWest IndiesWestern AfricaWestern AsiaWestern EuropeYemenZaireZimbabweAzores
Bhutanese
Race
Ancestry
AfghanAfricanAlaska NativeAlaskan AthabascanAlbanianAleutAlsatianAmericanApacheArabArapahoArgentineanArmenianAssyrian/Chaldean/SyriacAustralianAustrianBahamianBangladeshiBarbadianBasqueBelgianBelizeanBermudanBhutaneseBlackfeetBolivianBrazilianBritishBritish West IndianBulgarianBurmeseCajunCambodianCanadianCape VerdeanCarpatho RusynCelticCentral AmericanCentral American IndianCherokeeCheyenneChickasawChileanChineseChippewaChoctawColombianColvilleComancheCosta RicanCreeCreekCroatianCrowCubanCypriotCzechCzechoslovakianDanishDelawareDominicanDutchDutch West IndianEastern EuropeanEcuadorianEgyptianEnglishEstonianEthiopianEuropeanFijianFilipinoFinnishFrenchFrench American IndianFrench CanadianGermanGerman RussianGhanaianGreekGuamanian/ChamorroGuatemalanGuyaneseHaitianHmongHonduranHopiHoumaHungarianIcelanderIndian (Asian)IndonesianInupiatIranianIraqiIrishIroquoisIsraeliItalianJamaicanJapaneseJordanianKenyanKiowaKoreanLaotianLatvianLebaneseLiberianLithuanianLumbeeLuxembourgerMacedonianMalaysianMalteseMarshalleseMenomineeMexicanMexican American IndianMongolianMoroccanNative HawaiianNavajoNepaleseNew ZealanderNicaraguanNigerianNorthern EuropeanNorwegianOkinawanOsageOttawaPaiutePakistaniPalestinianPanamanianParaguayanPennsylvania GermanPeruvianPimaPolishPortuguesePotawatomiPuebloPuerto RicanPuget Sound SalishRomanianRussianSalvadoranSamoanScandinavianScotch-IrishScottishSeminoleSenegaleseSerbianShoshoneSierra LeoneanSiouxSlavicSlovakSloveneSomaliSouth AfricanSouth AmericanSouth American IndianSoviet UnionSpaniardSpanishSpanish AmericanSpanish American IndianSri LankanSubsaharan AfricanSudaneseSwedishSwissSyrianTaiwaneseThaiTlingit-HaidaTohono O'OdhamTonganTrinidadian and TobagonianTsimshianTurkishU.S. Virgin IslanderUgandanUkrainianUruguayanUteVenezuelanVietnameseWelshWest IndianYakamaYaquiYugoslavianYumanYup'ikZimbabwean
Immigration
NonimmigrantsImmigrantsAfghanistanAfricaAlbaniaArgentinaArmeniaAsiaAustraliaAustriaBahamasBangladeshBarbadosBelarusBelgiumBelizeBoliviaBosnia and HerzegovinaBrazilBulgariaBurma/MyanmarCabo VerdeCambodiaCameroonCanadaCaribbeanCentral AmericaChileChinaColombiaCongoCosta RicaCroatiaCubaCzechoslovakiaDenmarkDominicaDominican RepublicEastern AfricaEastern AsiaEastern EuropeEcuadorEgyptEl SalvadorEnglandEritreaEthiopiaEuropeFijiFranceGermanyGhanaGreeceGrenadaGuatemalaGuyanaHaitiHondurasHong KongHungaryIndiaIndonesiaIranIraqIrelandIsraelItalyJamaicaJapanJordanKazakhstanKenyaKoreaKuwaitLaosLatin AmericaLatviaLebanonLiberiaLithuaniaMexicoMicronesiaMiddle AfricaMoldovaMoroccoNepalNetherlandsNicaraguaNigeriaNorth AmericaNorth MacedoniaNorthern AfricaNorthern EuropeNorwayOceaniaPakistanPanamaPeruPhilippinesPolandPortugalRomaniaRussiaSaudi ArabiaScotlandSenegalSerbiaSierra LeoneSingaporeSomaliaSouth AfricaSouth AmericaSouth Central AsiaSouth Eastern AsiaSouthern EuropeSpainSri LankaSt. Vincent and the GrenadinesSudanSwedenSwitzerlandSyriaTaiwanThailandTrinidad and TobagoTurkeyUgandaUkraineUruguayUzbekistanVenezuelaVietnamWest IndiesWestern AfricaWestern AsiaWestern EuropeYemenZaireZimbabweAzores
Median Family Income
Income
Poverty
Unemployment
Labor Participation
Family Structure
Vehicle Availability
Education Level
Disability

Median Family Income Comparison

Immigrants from Malaysia

Bhutanese

Exceptional
Exceptional
$115,880
MEDIAN FAMILY INCOME
99.9/ 100
METRIC RATING
51st/ 347
METRIC RANK
$119,800
MEDIAN FAMILY INCOME
100.0/ 100
METRIC RATING
33rd/ 347
METRIC RANK

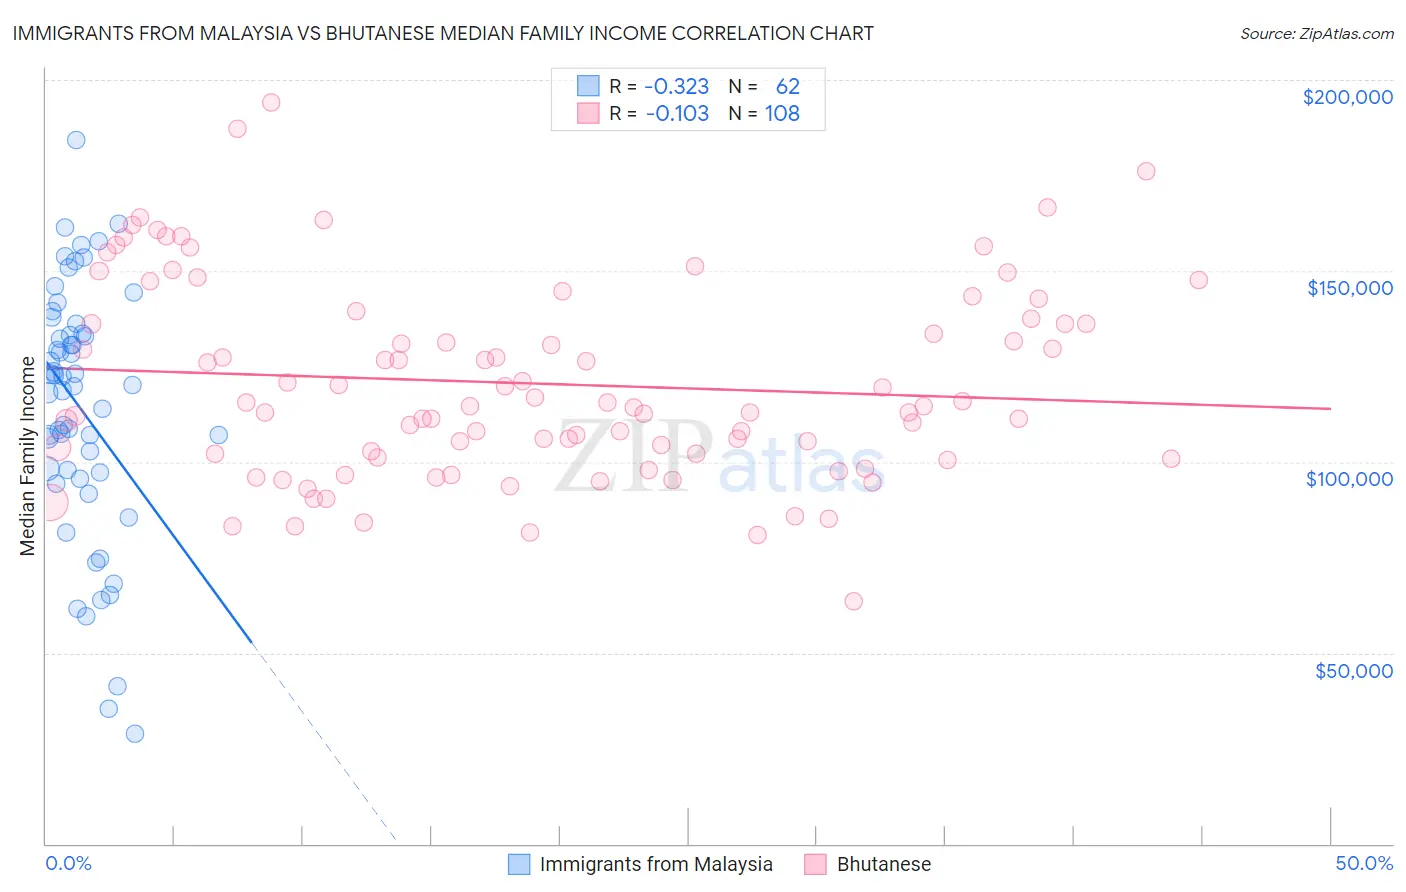
Immigrants from Malaysia vs Bhutanese Median Family Income Correlation Chart

The statistical analysis conducted on geographies consisting of 197,888,564 people shows a mild negative correlation between the proportion of Immigrants from Malaysia and median family income in the United States with a correlation coefficient (R) of -0.323 and weighted average of $115,880. Similarly, the statistical analysis conducted on geographies consisting of 454,953,353 people shows a poor negative correlation between the proportion of Bhutanese and median family income in the United States with a correlation coefficient (R) of -0.103 and weighted average of $119,800, a difference of 3.4%.
Immigrants from Malaysia vs Bhutanese Median Family Income

Median Family Income Correlation Summary

MeasurementImmigrants from MalaysiaBhutanese
Minimum$28,750$63,382
Maximum$184,295$194,165
Range$155,545$130,783
Mean$113,996$120,532
Median$119,915$114,614
Interquartile 25% (IQ1)$97,359$101,662
Interquartile 75% (IQ3)$133,700$136,845
Interquartile Range (IQR)$36,341$35,183
Standard Deviation (Sample)$32,874$25,704
Standard Deviation (Population)$32,608$25,585

Demographics Similar to Immigrants from Malaysia and Bhutanese by Median Family Income

In terms of median family income, the demographic groups most similar to Immigrants from Malaysia are Maltese ($115,862, a difference of 0.010%), Immigrants from Czechoslovakia ($116,165, a difference of 0.25%), Chinese ($116,188, a difference of 0.27%), Immigrants from South Africa ($116,286, a difference of 0.35%), and Immigrants from Austria ($116,830, a difference of 0.82%). Similarly, the demographic groups most similar to Bhutanese are Asian ($119,955, a difference of 0.13%), Bolivian ($119,479, a difference of 0.27%), Soviet Union ($119,262, a difference of 0.45%), Israeli ($118,577, a difference of 1.0%), and Australian ($118,440, a difference of 1.1%).
DemographicsRating | RankMedian Family Income
Asians
100.0
/100
|
#32
Exceptional
$119,955
Bhutanese
100.0
/100
|
#33
Exceptional
$119,800
Bolivians
100.0
/100
|
#34
Exceptional
$119,479
Soviet Union
100.0
/100
|
#35
Exceptional
$119,262
Israelis
100.0
/100
|
#36
Exceptional
$118,577
Australians
100.0
/100
|
#37
Exceptional
$118,440
Immigrants | Turkey
100.0
/100
|
#38
Exceptional
$118,325
Immigrants | Asia
100.0
/100
|
#39
Exceptional
$118,291
Immigrants | Lithuania
100.0
/100
|
#40
Exceptional
$118,053
Estonians
100.0
/100
|
#41
Exceptional
$118,013
Immigrants | Bolivia
100.0
/100
|
#42
Exceptional
$117,912
Bulgarians
100.0
/100
|
#43
Exceptional
$117,818
Cambodians
100.0
/100
|
#44
Exceptional
$117,780
Immigrants | Greece
99.9
/100
|
#45
Exceptional
$117,344
Immigrants | Russia
99.9
/100
|
#46
Exceptional
$116,942
Immigrants | Austria
99.9
/100
|
#47
Exceptional
$116,830
Immigrants | South Africa
99.9
/100
|
#48
Exceptional
$116,286
Chinese
99.9
/100
|
#49
Exceptional
$116,188
Immigrants | Czechoslovakia
99.9
/100
|
#50
Exceptional
$116,165
Immigrants | Malaysia
99.9
/100
|
#51
Exceptional
$115,880
Maltese
99.9
/100
|
#52
Exceptional
$115,862