Immigrants from Lebanon vs Ute Median Male Earnings
COMPARE
Immigrants from Lebanon
Ute
Median Male Earnings
Median Male Earnings Comparison
Immigrants from Lebanon
Ute
$58,835
MEDIAN MALE EARNINGS
98.6/ 100
METRIC RATING
95th/ 347
METRIC RANK
$48,899
MEDIAN MALE EARNINGS
0.4/ 100
METRIC RATING
268th/ 347
METRIC RANK
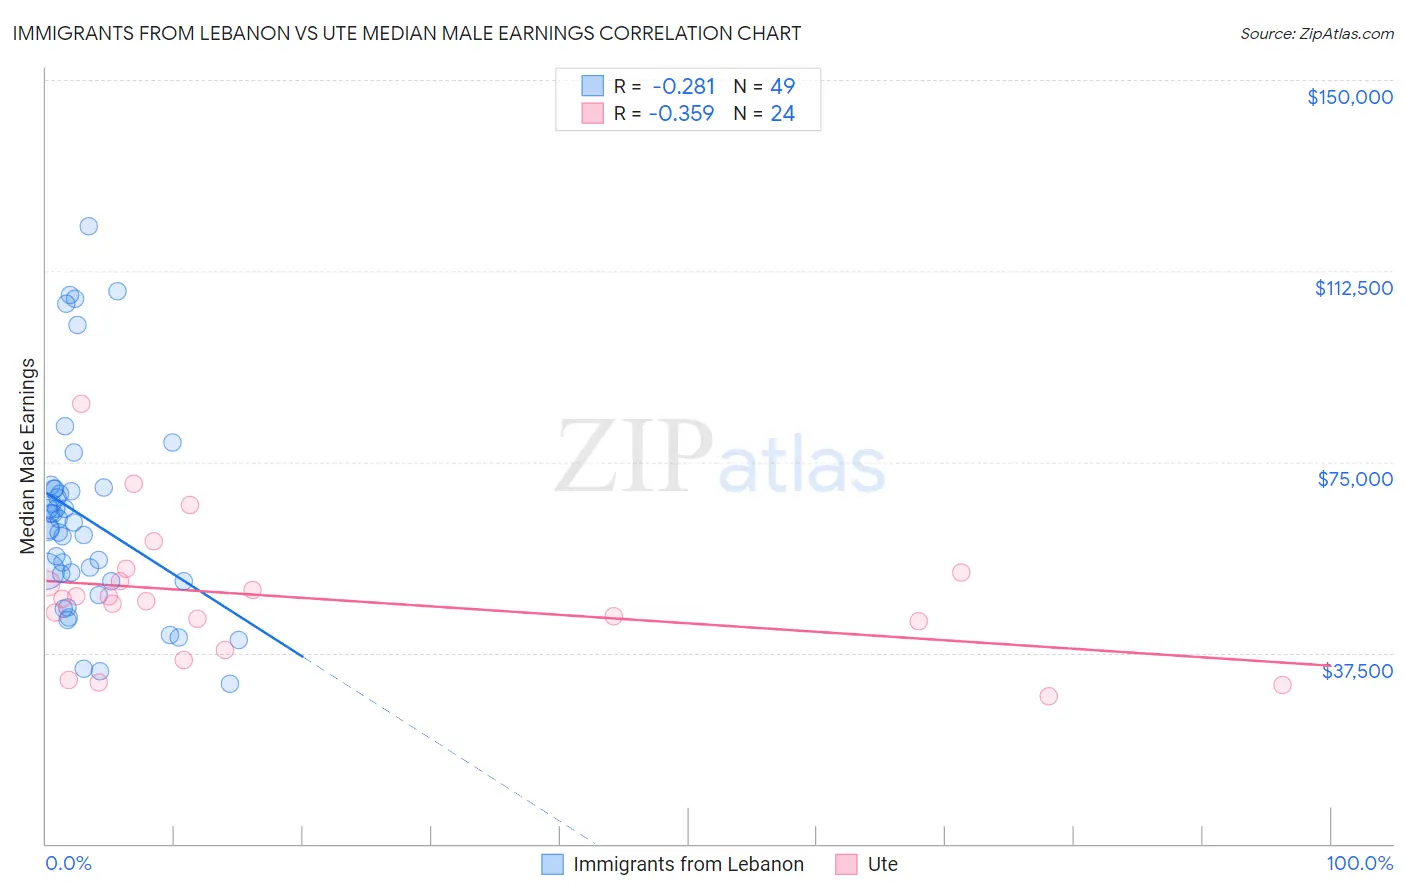
Immigrants from Lebanon vs Ute Median Male Earnings Correlation Chart
The statistical analysis conducted on geographies consisting of 217,125,593 people shows a weak negative correlation between the proportion of Immigrants from Lebanon and median male earnings in the United States with a correlation coefficient (R) of -0.281 and weighted average of $58,835. Similarly, the statistical analysis conducted on geographies consisting of 55,657,801 people shows a mild negative correlation between the proportion of Ute and median male earnings in the United States with a correlation coefficient (R) of -0.359 and weighted average of $48,899, a difference of 20.3%.
Median Male Earnings Correlation Summary
| Measurement | Immigrants from Lebanon | Ute |
| Minimum | $31,325 | $28,875 |
| Maximum | $121,345 | $86,490 |
| Range | $90,020 | $57,615 |
| Mean | $64,055 | $48,301 |
| Median | $61,932 | $47,968 |
| Interquartile 25% (IQ1) | $51,586 | $40,774 |
| Interquartile 75% (IQ3) | $69,695 | $52,454 |
| Interquartile Range (IQR) | $18,109 | $11,681 |
| Standard Deviation (Sample) | $20,593 | $13,224 |
| Standard Deviation (Population) | $20,382 | $12,945 |
Similar Demographics by Median Male Earnings
Demographics Similar to Immigrants from Lebanon by Median Male Earnings
In terms of median male earnings, the demographic groups most similar to Immigrants from Lebanon are Albanian ($58,680, a difference of 0.27%), Northern European ($58,588, a difference of 0.42%), Jordanian ($58,500, a difference of 0.57%), Immigrants from North Macedonia ($59,189, a difference of 0.60%), and Immigrants from Southern Europe ($59,217, a difference of 0.65%).
| Demographics | Rating | Rank | Median Male Earnings |
| Immigrants | Argentina | 99.3 /100 | #88 | Exceptional $59,491 |
| Immigrants | Moldova | 99.2 /100 | #89 | Exceptional $59,417 |
| Austrians | 99.2 /100 | #90 | Exceptional $59,359 |
| Laotians | 99.2 /100 | #91 | Exceptional $59,351 |
| Immigrants | Kazakhstan | 99.1 /100 | #92 | Exceptional $59,278 |
| Immigrants | Southern Europe | 99.0 /100 | #93 | Exceptional $59,217 |
| Immigrants | North Macedonia | 99.0 /100 | #94 | Exceptional $59,189 |
| Immigrants | Lebanon | 98.6 /100 | #95 | Exceptional $58,835 |
| Albanians | 98.4 /100 | #96 | Exceptional $58,680 |
| Northern Europeans | 98.2 /100 | #97 | Exceptional $58,588 |
| Jordanians | 98.1 /100 | #98 | Exceptional $58,500 |
| Immigrants | Poland | 98.0 /100 | #99 | Exceptional $58,452 |
| Assyrians/Chaldeans/Syriacs | 97.9 /100 | #100 | Exceptional $58,437 |
| Immigrants | Brazil | 97.7 /100 | #101 | Exceptional $58,324 |
| Syrians | 97.4 /100 | #102 | Exceptional $58,187 |
Demographics Similar to Ute by Median Male Earnings
In terms of median male earnings, the demographic groups most similar to Ute are Tsimshian ($48,836, a difference of 0.13%), Spanish American ($49,008, a difference of 0.22%), Somali ($49,025, a difference of 0.26%), Potawatomi ($48,768, a difference of 0.27%), and Cherokee ($48,669, a difference of 0.47%).
| Demographics | Rating | Rank | Median Male Earnings |
| Liberians | 0.6 /100 | #261 | Tragic $49,318 |
| Immigrants | West Indies | 0.6 /100 | #262 | Tragic $49,271 |
| Nicaraguans | 0.6 /100 | #263 | Tragic $49,215 |
| Immigrants | Middle Africa | 0.6 /100 | #264 | Tragic $49,201 |
| Immigrants | Laos | 0.6 /100 | #265 | Tragic $49,190 |
| Somalis | 0.5 /100 | #266 | Tragic $49,025 |
| Spanish Americans | 0.5 /100 | #267 | Tragic $49,008 |
| Ute | 0.4 /100 | #268 | Tragic $48,899 |
| Tsimshian | 0.4 /100 | #269 | Tragic $48,836 |
| Potawatomi | 0.4 /100 | #270 | Tragic $48,768 |
| Cherokee | 0.3 /100 | #271 | Tragic $48,669 |
| Salvadorans | 0.3 /100 | #272 | Tragic $48,646 |
| Jamaicans | 0.3 /100 | #273 | Tragic $48,632 |
| Colville | 0.3 /100 | #274 | Tragic $48,516 |
| Immigrants | Somalia | 0.3 /100 | #275 | Tragic $48,439 |