Cheyenne vs Ute Median Male Earnings
COMPARE
Cheyenne
Ute
Median Male Earnings
Median Male Earnings Comparison
Cheyenne
Ute
$46,062
MEDIAN MALE EARNINGS
0.0/ 100
METRIC RATING
318th/ 347
METRIC RANK
$48,899
MEDIAN MALE EARNINGS
0.4/ 100
METRIC RATING
268th/ 347
METRIC RANK
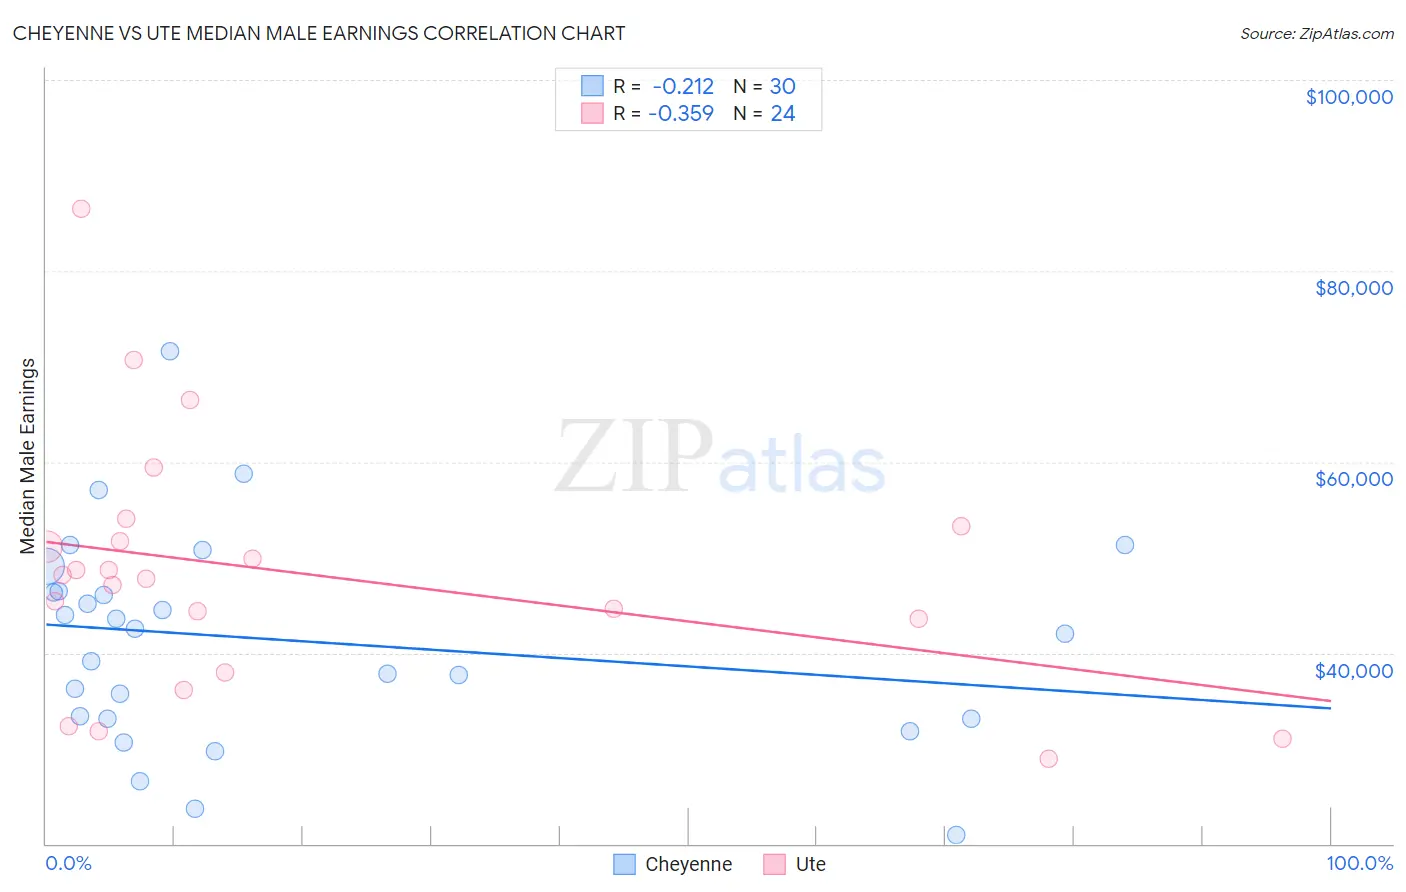
Cheyenne vs Ute Median Male Earnings Correlation Chart
The statistical analysis conducted on geographies consisting of 80,706,071 people shows a weak negative correlation between the proportion of Cheyenne and median male earnings in the United States with a correlation coefficient (R) of -0.212 and weighted average of $46,062. Similarly, the statistical analysis conducted on geographies consisting of 55,657,801 people shows a mild negative correlation between the proportion of Ute and median male earnings in the United States with a correlation coefficient (R) of -0.359 and weighted average of $48,899, a difference of 6.2%.
Median Male Earnings Correlation Summary
| Measurement | Cheyenne | Ute |
| Minimum | $20,903 | $28,875 |
| Maximum | $71,550 | $86,490 |
| Range | $50,647 | $57,615 |
| Mean | $41,316 | $48,301 |
| Median | $42,260 | $47,968 |
| Interquartile 25% (IQ1) | $33,100 | $40,774 |
| Interquartile 75% (IQ3) | $46,481 | $52,454 |
| Interquartile Range (IQR) | $13,381 | $11,681 |
| Standard Deviation (Sample) | $10,984 | $13,224 |
| Standard Deviation (Population) | $10,799 | $12,945 |
Similar Demographics by Median Male Earnings
Demographics Similar to Cheyenne by Median Male Earnings
In terms of median male earnings, the demographic groups most similar to Cheyenne are Mexican ($46,147, a difference of 0.18%), Immigrants from Caribbean ($46,193, a difference of 0.28%), Haitian ($45,903, a difference of 0.35%), Immigrants from Guatemala ($46,244, a difference of 0.39%), and Immigrants from Honduras ($45,787, a difference of 0.60%).
| Demographics | Rating | Rank | Median Male Earnings |
| Apache | 0.0 /100 | #311 | Tragic $46,429 |
| Hispanics or Latinos | 0.0 /100 | #312 | Tragic $46,419 |
| Hondurans | 0.0 /100 | #313 | Tragic $46,374 |
| Chippewa | 0.0 /100 | #314 | Tragic $46,368 |
| Immigrants | Guatemala | 0.0 /100 | #315 | Tragic $46,244 |
| Immigrants | Caribbean | 0.0 /100 | #316 | Tragic $46,193 |
| Mexicans | 0.0 /100 | #317 | Tragic $46,147 |
| Cheyenne | 0.0 /100 | #318 | Tragic $46,062 |
| Haitians | 0.0 /100 | #319 | Tragic $45,903 |
| Immigrants | Honduras | 0.0 /100 | #320 | Tragic $45,787 |
| Fijians | 0.0 /100 | #321 | Tragic $45,607 |
| Sioux | 0.0 /100 | #322 | Tragic $45,566 |
| Immigrants | Central America | 0.0 /100 | #323 | Tragic $45,538 |
| Blacks/African Americans | 0.0 /100 | #324 | Tragic $45,523 |
| Yuman | 0.0 /100 | #325 | Tragic $45,446 |
Demographics Similar to Ute by Median Male Earnings
In terms of median male earnings, the demographic groups most similar to Ute are Tsimshian ($48,836, a difference of 0.13%), Spanish American ($49,008, a difference of 0.22%), Somali ($49,025, a difference of 0.26%), Potawatomi ($48,768, a difference of 0.27%), and Cherokee ($48,669, a difference of 0.47%).
| Demographics | Rating | Rank | Median Male Earnings |
| Liberians | 0.6 /100 | #261 | Tragic $49,318 |
| Immigrants | West Indies | 0.6 /100 | #262 | Tragic $49,271 |
| Nicaraguans | 0.6 /100 | #263 | Tragic $49,215 |
| Immigrants | Middle Africa | 0.6 /100 | #264 | Tragic $49,201 |
| Immigrants | Laos | 0.6 /100 | #265 | Tragic $49,190 |
| Somalis | 0.5 /100 | #266 | Tragic $49,025 |
| Spanish Americans | 0.5 /100 | #267 | Tragic $49,008 |
| Ute | 0.4 /100 | #268 | Tragic $48,899 |
| Tsimshian | 0.4 /100 | #269 | Tragic $48,836 |
| Potawatomi | 0.4 /100 | #270 | Tragic $48,768 |
| Cherokee | 0.3 /100 | #271 | Tragic $48,669 |
| Salvadorans | 0.3 /100 | #272 | Tragic $48,646 |
| Jamaicans | 0.3 /100 | #273 | Tragic $48,632 |
| Colville | 0.3 /100 | #274 | Tragic $48,516 |
| Immigrants | Somalia | 0.3 /100 | #275 | Tragic $48,439 |