Immigrants from Latin America vs Immigrants from Bahamas Householder Income Ages 45 - 64 years

COMPARE

Immigrants from Latin America
Race
Ancestry
AfghanAfricanAlaska NativeAlaskan AthabascanAlbanianAleutAlsatianAmericanApacheArabArapahoArgentineanArmenianAssyrian/Chaldean/SyriacAustralianAustrianBahamianBangladeshiBarbadianBasqueBelgianBelizeanBermudanBhutaneseBlackfeetBolivianBrazilianBritishBritish West IndianBulgarianBurmeseCajunCambodianCanadianCape VerdeanCarpatho RusynCelticCentral AmericanCentral American IndianCherokeeCheyenneChickasawChileanChineseChippewaChoctawColombianColvilleComancheCosta RicanCreeCreekCroatianCrowCubanCypriotCzechCzechoslovakianDanishDelawareDominicanDutchDutch West IndianEastern EuropeanEcuadorianEgyptianEnglishEstonianEthiopianEuropeanFijianFilipinoFinnishFrenchFrench American IndianFrench CanadianGermanGerman RussianGhanaianGreekGuamanian/ChamorroGuatemalanGuyaneseHaitianHmongHonduranHopiHoumaHungarianIcelanderIndian (Asian)IndonesianInupiatIranianIraqiIrishIroquoisIsraeliItalianJamaicanJapaneseJordanianKenyanKiowaKoreanLaotianLatvianLebaneseLiberianLithuanianLumbeeLuxembourgerMacedonianMalaysianMalteseMarshalleseMenomineeMexicanMexican American IndianMongolianMoroccanNative HawaiianNavajoNepaleseNew ZealanderNicaraguanNigerianNorthern EuropeanNorwegianOkinawanOsageOttawaPaiutePakistaniPalestinianPanamanianParaguayanPennsylvania GermanPeruvianPimaPolishPortuguesePotawatomiPuebloPuerto RicanPuget Sound SalishRomanianRussianSalvadoranSamoanScandinavianScotch-IrishScottishSeminoleSenegaleseSerbianShoshoneSierra LeoneanSiouxSlavicSlovakSloveneSomaliSouth AfricanSouth AmericanSouth American IndianSoviet UnionSpaniardSpanishSpanish AmericanSpanish American IndianSri LankanSubsaharan AfricanSudaneseSwedishSwissSyrianTaiwaneseThaiTlingit-HaidaTohono O'OdhamTonganTrinidadian and TobagonianTsimshianTurkishU.S. Virgin IslanderUgandanUkrainianUruguayanUteVenezuelanVietnameseWelshWest IndianYakamaYaquiYugoslavianYumanYup'ikZimbabwean
Immigration
NonimmigrantsImmigrantsAfghanistanAfricaAlbaniaArgentinaArmeniaAsiaAustraliaAustriaBangladeshBarbadosBelarusBelgiumBelizeBoliviaBosnia and HerzegovinaBrazilBulgariaBurma/MyanmarCabo VerdeCambodiaCameroonCanadaCaribbeanCentral AmericaChileChinaColombiaCongoCosta RicaCroatiaCubaCzechoslovakiaDenmarkDominicaDominican RepublicEastern AfricaEastern AsiaEastern EuropeEcuadorEgyptEl SalvadorEnglandEritreaEthiopiaEuropeFijiFranceGermanyGhanaGreeceGrenadaGuatemalaGuyanaHaitiHondurasHong KongHungaryIndiaIndonesiaIranIraqIrelandIsraelItalyJamaicaJapanJordanKazakhstanKenyaKoreaKuwaitLaosLatin AmericaLatviaLebanonLiberiaLithuaniaMalaysiaMexicoMicronesiaMiddle AfricaMoldovaMoroccoNepalNetherlandsNicaraguaNigeriaNorth AmericaNorth MacedoniaNorthern AfricaNorthern EuropeNorwayOceaniaPakistanPanamaPeruPhilippinesPolandPortugalRomaniaRussiaSaudi ArabiaScotlandSenegalSerbiaSierra LeoneSingaporeSomaliaSouth AfricaSouth AmericaSouth Central AsiaSouth Eastern AsiaSouthern EuropeSpainSri LankaSt. Vincent and the GrenadinesSudanSwedenSwitzerlandSyriaTaiwanThailandTrinidad and TobagoTurkeyUgandaUkraineUruguayUzbekistanVenezuelaVietnamWest IndiesWestern AfricaWestern AsiaWestern EuropeYemenZaireZimbabweAzores
Immigrants from Bahamas
Race
Ancestry
AfghanAfricanAlaska NativeAlaskan AthabascanAlbanianAleutAlsatianAmericanApacheArabArapahoArgentineanArmenianAssyrian/Chaldean/SyriacAustralianAustrianBahamianBangladeshiBarbadianBasqueBelgianBelizeanBermudanBhutaneseBlackfeetBolivianBrazilianBritishBritish West IndianBulgarianBurmeseCajunCambodianCanadianCape VerdeanCarpatho RusynCelticCentral AmericanCentral American IndianCherokeeCheyenneChickasawChileanChineseChippewaChoctawColombianColvilleComancheCosta RicanCreeCreekCroatianCrowCubanCypriotCzechCzechoslovakianDanishDelawareDominicanDutchDutch West IndianEastern EuropeanEcuadorianEgyptianEnglishEstonianEthiopianEuropeanFijianFilipinoFinnishFrenchFrench American IndianFrench CanadianGermanGerman RussianGhanaianGreekGuamanian/ChamorroGuatemalanGuyaneseHaitianHmongHonduranHopiHoumaHungarianIcelanderIndian (Asian)IndonesianInupiatIranianIraqiIrishIroquoisIsraeliItalianJamaicanJapaneseJordanianKenyanKiowaKoreanLaotianLatvianLebaneseLiberianLithuanianLumbeeLuxembourgerMacedonianMalaysianMalteseMarshalleseMenomineeMexicanMexican American IndianMongolianMoroccanNative HawaiianNavajoNepaleseNew ZealanderNicaraguanNigerianNorthern EuropeanNorwegianOkinawanOsageOttawaPaiutePakistaniPalestinianPanamanianParaguayanPennsylvania GermanPeruvianPimaPolishPortuguesePotawatomiPuebloPuerto RicanPuget Sound SalishRomanianRussianSalvadoranSamoanScandinavianScotch-IrishScottishSeminoleSenegaleseSerbianShoshoneSierra LeoneanSiouxSlavicSlovakSloveneSomaliSouth AfricanSouth AmericanSouth American IndianSoviet UnionSpaniardSpanishSpanish AmericanSpanish American IndianSri LankanSubsaharan AfricanSudaneseSwedishSwissSyrianTaiwaneseThaiTlingit-HaidaTohono O'OdhamTonganTrinidadian and TobagonianTsimshianTurkishU.S. Virgin IslanderUgandanUkrainianUruguayanUteVenezuelanVietnameseWelshWest IndianYakamaYaquiYugoslavianYumanYup'ikZimbabwean
Immigration
NonimmigrantsImmigrantsAfghanistanAfricaAlbaniaArgentinaArmeniaAsiaAustraliaAustriaBahamasBangladeshBarbadosBelarusBelgiumBelizeBoliviaBosnia and HerzegovinaBrazilBulgariaBurma/MyanmarCabo VerdeCambodiaCameroonCanadaCaribbeanCentral AmericaChileChinaColombiaCongoCosta RicaCroatiaCubaCzechoslovakiaDenmarkDominicaDominican RepublicEastern AfricaEastern AsiaEastern EuropeEcuadorEgyptEl SalvadorEnglandEritreaEthiopiaEuropeFijiFranceGermanyGhanaGreeceGrenadaGuatemalaGuyanaHaitiHondurasHong KongHungaryIndiaIndonesiaIranIraqIrelandIsraelItalyJamaicaJapanJordanKazakhstanKenyaKoreaKuwaitLaosLatviaLebanonLiberiaLithuaniaMalaysiaMexicoMicronesiaMiddle AfricaMoldovaMoroccoNepalNetherlandsNicaraguaNigeriaNorth AmericaNorth MacedoniaNorthern AfricaNorthern EuropeNorwayOceaniaPakistanPanamaPeruPhilippinesPolandPortugalRomaniaRussiaSaudi ArabiaScotlandSenegalSerbiaSierra LeoneSingaporeSomaliaSouth AfricaSouth AmericaSouth Central AsiaSouth Eastern AsiaSouthern EuropeSpainSri LankaSt. Vincent and the GrenadinesSudanSwedenSwitzerlandSyriaTaiwanThailandTrinidad and TobagoTurkeyUgandaUkraineUruguayUzbekistanVenezuelaVietnamWest IndiesWestern AfricaWestern AsiaWestern EuropeYemenZaireZimbabweAzores
Householder Income Ages 45 - 64 years
Income
Poverty
Unemployment
Labor Participation
Family Structure
Vehicle Availability
Education Level
Disability

Householder Income Ages 45 - 64 years Comparison

Immigrants from Latin America

Immigrants from Bahamas

Tragic
Tragic
$87,219
HOUSEHOLDER INCOME AGES 45 - 64 YEARS
0.1/ 100
METRIC RATING
276th/ 347
METRIC RANK
$83,177
HOUSEHOLDER INCOME AGES 45 - 64 YEARS
0.0/ 100
METRIC RATING
311th/ 347
METRIC RANK

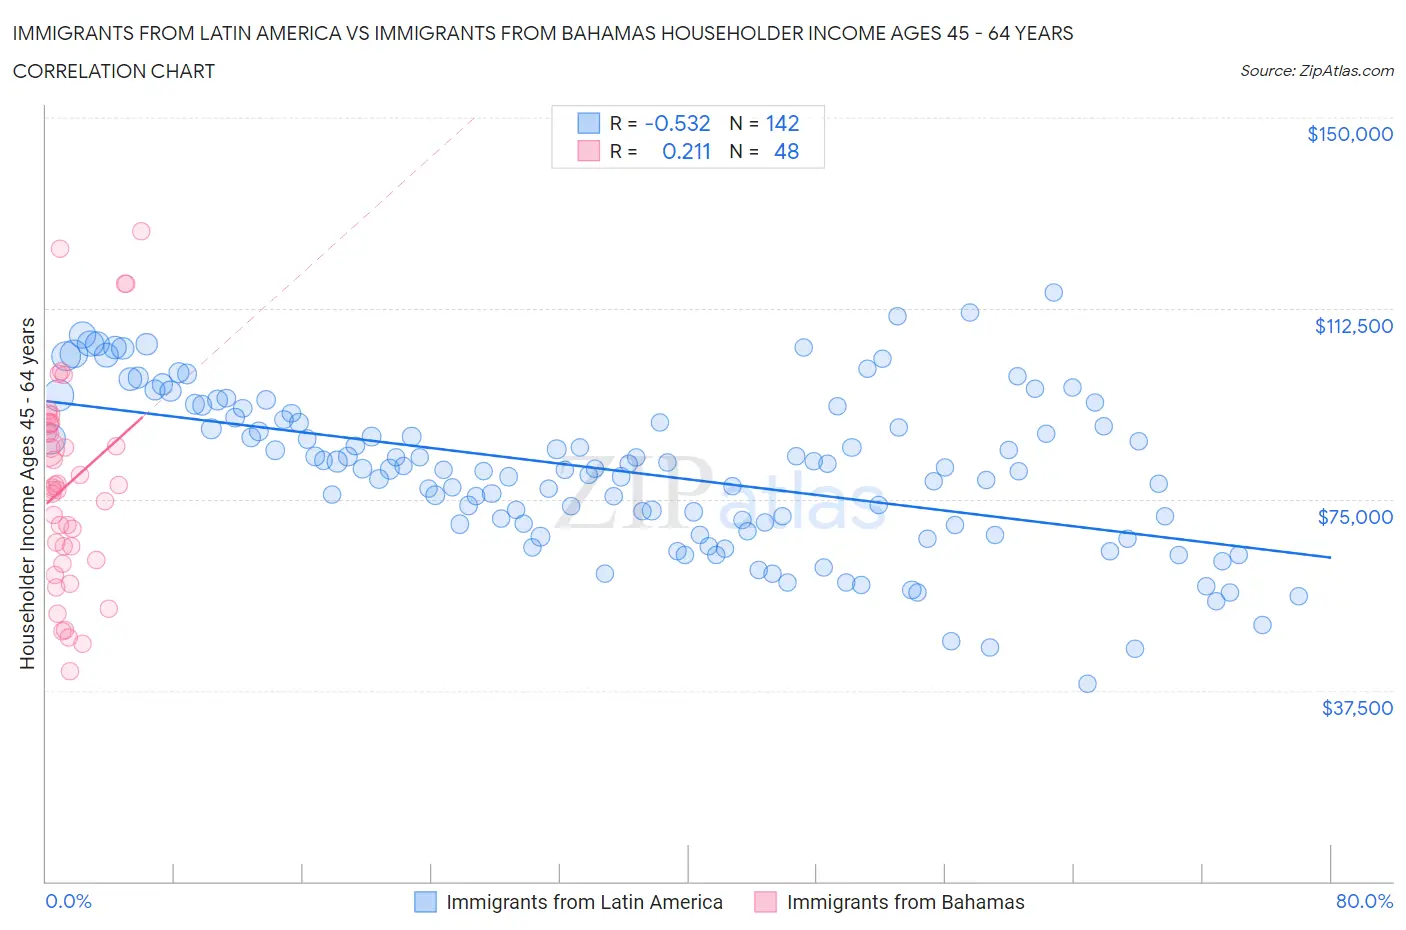
Immigrants from Latin America vs Immigrants from Bahamas Householder Income Ages 45 - 64 years Correlation Chart

The statistical analysis conducted on geographies consisting of 555,418,501 people shows a substantial negative correlation between the proportion of Immigrants from Latin America and household income with householder between the ages 45 and 64 in the United States with a correlation coefficient (R) of -0.532 and weighted average of $87,219. Similarly, the statistical analysis conducted on geographies consisting of 104,531,402 people shows a weak positive correlation between the proportion of Immigrants from Bahamas and household income with householder between the ages 45 and 64 in the United States with a correlation coefficient (R) of 0.211 and weighted average of $83,177, a difference of 4.9%.
Immigrants from Latin America vs Immigrants from Bahamas Householder Income Ages 45 - 64 years

Householder Income Ages 45 - 64 years Correlation Summary

MeasurementImmigrants from Latin AmericaImmigrants from Bahamas
Minimum$38,838$41,195
Maximum$115,549$127,688
Range$76,711$86,493
Mean$80,477$78,060
Median$81,005$77,570
Interquartile 25% (IQ1)$70,093$64,406
Interquartile 75% (IQ3)$90,998$89,869
Interquartile Range (IQR)$20,906$25,463
Standard Deviation (Sample)$15,402$20,104
Standard Deviation (Population)$15,348$19,893

Similar Demographics by Householder Income Ages 45 - 64 years

Demographics Similar to Immigrants from Latin America by Householder Income Ages 45 - 64 years

In terms of householder income ages 45 - 64 years, the demographic groups most similar to Immigrants from Latin America are Immigrants from Belize ($87,229, a difference of 0.010%), Iroquois ($87,255, a difference of 0.040%), Cree ($87,185, a difference of 0.040%), Immigrants from Jamaica ($87,035, a difference of 0.21%), and Yakama ($86,992, a difference of 0.26%).
DemographicsRating | RankHouseholder Income Ages 45 - 64 years
Spanish Americans
0.2
/100
|
#269
Tragic
$87,836
Immigrants | Liberia
0.2
/100
|
#270
Tragic
$87,739
Guatemalans
0.2
/100
|
#271
Tragic
$87,705
Cape Verdeans
0.2
/100
|
#272
Tragic
$87,580
Spanish American Indians
0.2
/100
|
#273
Tragic
$87,561
Iroquois
0.1
/100
|
#274
Tragic
$87,255
Immigrants | Belize
0.1
/100
|
#275
Tragic
$87,229
Immigrants | Latin America
0.1
/100
|
#276
Tragic
$87,219
Cree
0.1
/100
|
#277
Tragic
$87,185
Immigrants | Jamaica
0.1
/100
|
#278
Tragic
$87,035
Yakama
0.1
/100
|
#279
Tragic
$86,992
Immigrants | Somalia
0.1
/100
|
#280
Tragic
$86,987
Yaqui
0.1
/100
|
#281
Tragic
$86,914
Senegalese
0.1
/100
|
#282
Tragic
$86,897
Mexicans
0.1
/100
|
#283
Tragic
$86,816

Demographics Similar to Immigrants from Bahamas by Householder Income Ages 45 - 64 years

In terms of householder income ages 45 - 64 years, the demographic groups most similar to Immigrants from Bahamas are Immigrants from Haiti ($83,257, a difference of 0.10%), Immigrants from Dominica ($83,311, a difference of 0.16%), Cajun ($83,015, a difference of 0.20%), Immigrants from Cabo Verde ($83,542, a difference of 0.44%), and Shoshone ($83,588, a difference of 0.49%).
DemographicsRating | RankHouseholder Income Ages 45 - 64 years
Ottawa
0.0
/100
|
#304
Tragic
$83,953
Chippewa
0.0
/100
|
#305
Tragic
$83,943
Ute
0.0
/100
|
#306
Tragic
$83,937
Shoshone
0.0
/100
|
#307
Tragic
$83,588
Immigrants | Cabo Verde
0.0
/100
|
#308
Tragic
$83,542
Immigrants | Dominica
0.0
/100
|
#309
Tragic
$83,311
Immigrants | Haiti
0.0
/100
|
#310
Tragic
$83,257
Immigrants | Bahamas
0.0
/100
|
#311
Tragic
$83,177
Cajuns
0.0
/100
|
#312
Tragic
$83,015
U.S. Virgin Islanders
0.0
/100
|
#313
Tragic
$82,736
Immigrants | Honduras
0.0
/100
|
#314
Tragic
$82,697
Paiute
0.0
/100
|
#315
Tragic
$82,629
Immigrants | Caribbean
0.0
/100
|
#316
Tragic
$82,513
Colville
0.0
/100
|
#317
Tragic
$82,474
Choctaw
0.0
/100
|
#318
Tragic
$82,287