Immigrants from Latin America vs Immigrants from Uruguay Householder Income Ages 45 - 64 years
COMPARE
Immigrants from Latin America
Immigrants from Uruguay
Householder Income Ages 45 - 64 years
Householder Income Ages 45 - 64 years Comparison
Immigrants from Latin America
Immigrants from Uruguay
$87,219
HOUSEHOLDER INCOME AGES 45 - 64 YEARS
0.1/ 100
METRIC RATING
276th/ 347
METRIC RANK
$96,086
HOUSEHOLDER INCOME AGES 45 - 64 YEARS
10.7/ 100
METRIC RATING
213th/ 347
METRIC RANK
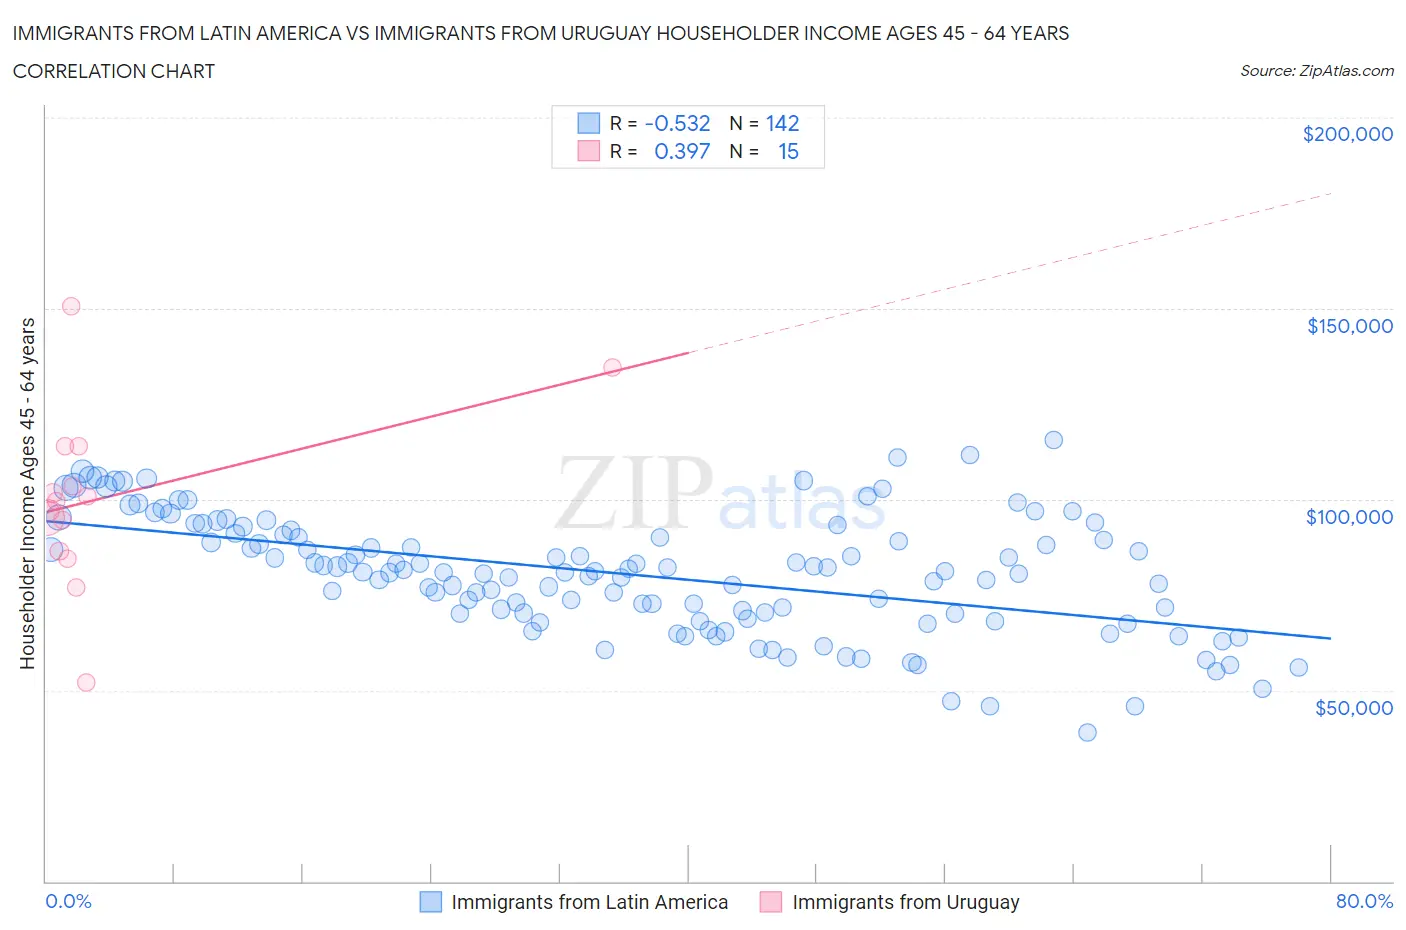
Immigrants from Latin America vs Immigrants from Uruguay Householder Income Ages 45 - 64 years Correlation Chart
The statistical analysis conducted on geographies consisting of 555,418,501 people shows a substantial negative correlation between the proportion of Immigrants from Latin America and household income with householder between the ages 45 and 64 in the United States with a correlation coefficient (R) of -0.532 and weighted average of $87,219. Similarly, the statistical analysis conducted on geographies consisting of 133,207,341 people shows a mild positive correlation between the proportion of Immigrants from Uruguay and household income with householder between the ages 45 and 64 in the United States with a correlation coefficient (R) of 0.397 and weighted average of $96,086, a difference of 10.2%.
Householder Income Ages 45 - 64 years Correlation Summary
| Measurement | Immigrants from Latin America | Immigrants from Uruguay |
| Minimum | $38,838 | $51,929 |
| Maximum | $115,549 | $150,685 |
| Range | $76,711 | $98,756 |
| Mean | $80,477 | $100,358 |
| Median | $81,005 | $99,578 |
| Interquartile 25% (IQ1) | $70,093 | $86,473 |
| Interquartile 75% (IQ3) | $90,998 | $113,852 |
| Interquartile Range (IQR) | $20,906 | $27,380 |
| Standard Deviation (Sample) | $15,402 | $23,140 |
| Standard Deviation (Population) | $15,348 | $22,356 |
Similar Demographics by Householder Income Ages 45 - 64 years
Demographics Similar to Immigrants from Latin America by Householder Income Ages 45 - 64 years
In terms of householder income ages 45 - 64 years, the demographic groups most similar to Immigrants from Latin America are Immigrants from Belize ($87,229, a difference of 0.010%), Iroquois ($87,255, a difference of 0.040%), Cree ($87,185, a difference of 0.040%), Immigrants from Jamaica ($87,035, a difference of 0.21%), and Yakama ($86,992, a difference of 0.26%).
| Demographics | Rating | Rank | Householder Income Ages 45 - 64 years |
| Spanish Americans | 0.2 /100 | #269 | Tragic $87,836 |
| Immigrants | Liberia | 0.2 /100 | #270 | Tragic $87,739 |
| Guatemalans | 0.2 /100 | #271 | Tragic $87,705 |
| Cape Verdeans | 0.2 /100 | #272 | Tragic $87,580 |
| Spanish American Indians | 0.2 /100 | #273 | Tragic $87,561 |
| Iroquois | 0.1 /100 | #274 | Tragic $87,255 |
| Immigrants | Belize | 0.1 /100 | #275 | Tragic $87,229 |
| Immigrants | Latin America | 0.1 /100 | #276 | Tragic $87,219 |
| Cree | 0.1 /100 | #277 | Tragic $87,185 |
| Immigrants | Jamaica | 0.1 /100 | #278 | Tragic $87,035 |
| Yakama | 0.1 /100 | #279 | Tragic $86,992 |
| Immigrants | Somalia | 0.1 /100 | #280 | Tragic $86,987 |
| Yaqui | 0.1 /100 | #281 | Tragic $86,914 |
| Senegalese | 0.1 /100 | #282 | Tragic $86,897 |
| Mexicans | 0.1 /100 | #283 | Tragic $86,816 |
Demographics Similar to Immigrants from Uruguay by Householder Income Ages 45 - 64 years
In terms of householder income ages 45 - 64 years, the demographic groups most similar to Immigrants from Uruguay are Panamanian ($96,066, a difference of 0.020%), Venezuelan ($96,460, a difference of 0.39%), Immigrants from Cambodia ($96,537, a difference of 0.47%), Nigerian ($95,492, a difference of 0.62%), and Tsimshian ($96,783, a difference of 0.73%).
| Demographics | Rating | Rank | Householder Income Ages 45 - 64 years |
| Immigrants | Africa | 17.9 /100 | #206 | Poor $97,284 |
| Ghanaians | 17.9 /100 | #207 | Poor $97,277 |
| Scotch-Irish | 16.4 /100 | #208 | Poor $97,073 |
| Japanese | 14.8 /100 | #209 | Poor $96,834 |
| Tsimshian | 14.5 /100 | #210 | Poor $96,783 |
| Immigrants | Cambodia | 13.0 /100 | #211 | Poor $96,537 |
| Venezuelans | 12.6 /100 | #212 | Poor $96,460 |
| Immigrants | Uruguay | 10.7 /100 | #213 | Poor $96,086 |
| Panamanians | 10.6 /100 | #214 | Poor $96,066 |
| Nigerians | 8.2 /100 | #215 | Tragic $95,492 |
| Immigrants | Venezuela | 7.6 /100 | #216 | Tragic $95,342 |
| Immigrants | Ghana | 6.4 /100 | #217 | Tragic $94,982 |
| Delaware | 6.2 /100 | #218 | Tragic $94,914 |
| Immigrants | Armenia | 6.1 /100 | #219 | Tragic $94,863 |
| Salvadorans | 6.0 /100 | #220 | Tragic $94,842 |