Immigrants from Laos vs Immigrants from Ireland Householder Income Under 25 years
COMPARE
Immigrants from Laos
Immigrants from Ireland
Householder Income Under 25 years
Householder Income Under 25 years Comparison
Immigrants from Laos
Immigrants from Ireland
$50,041
HOUSEHOLDER INCOME UNDER 25 YEARS
0.5/ 100
METRIC RATING
267th/ 347
METRIC RANK
$57,075
HOUSEHOLDER INCOME UNDER 25 YEARS
100.0/ 100
METRIC RATING
20th/ 347
METRIC RANK
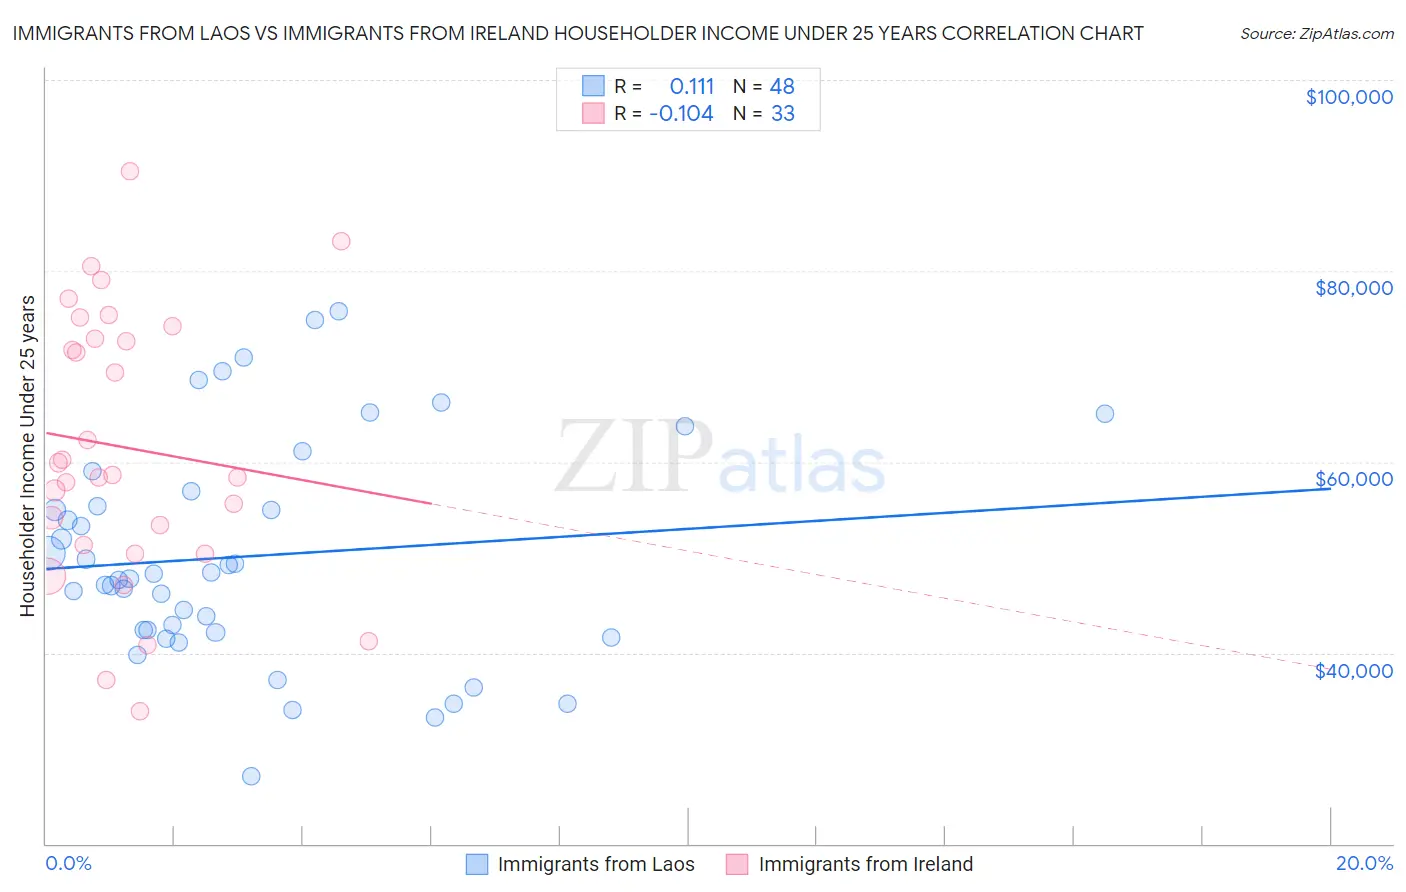
Immigrants from Laos vs Immigrants from Ireland Householder Income Under 25 years Correlation Chart
The statistical analysis conducted on geographies consisting of 183,790,099 people shows a poor positive correlation between the proportion of Immigrants from Laos and household income with householder under the age of 25 in the United States with a correlation coefficient (R) of 0.111 and weighted average of $50,041. Similarly, the statistical analysis conducted on geographies consisting of 203,844,468 people shows a poor negative correlation between the proportion of Immigrants from Ireland and household income with householder under the age of 25 in the United States with a correlation coefficient (R) of -0.104 and weighted average of $57,075, a difference of 14.1%.
Householder Income Under 25 years Correlation Summary
| Measurement | Immigrants from Laos | Immigrants from Ireland |
| Minimum | $27,039 | $33,875 |
| Maximum | $75,734 | $90,500 |
| Range | $48,695 | $56,625 |
| Mean | $50,097 | $61,493 |
| Median | $48,012 | $58,663 |
| Interquartile 25% (IQ1) | $42,252 | $50,831 |
| Interquartile 75% (IQ3) | $56,151 | $73,599 |
| Interquartile Range (IQR) | $13,899 | $22,768 |
| Standard Deviation (Sample) | $11,568 | $14,181 |
| Standard Deviation (Population) | $11,447 | $13,964 |
Similar Demographics by Householder Income Under 25 years
Demographics Similar to Immigrants from Laos by Householder Income Under 25 years
In terms of householder income under 25 years, the demographic groups most similar to Immigrants from Laos are Venezuelan ($50,011, a difference of 0.060%), Ute ($49,997, a difference of 0.090%), Mexican ($49,989, a difference of 0.10%), Belgian ($50,113, a difference of 0.14%), and Immigrants from Venezuela ($50,109, a difference of 0.14%).
| Demographics | Rating | Rank | Householder Income Under 25 years |
| Hispanics or Latinos | 0.9 /100 | #260 | Tragic $50,279 |
| Hungarians | 0.9 /100 | #261 | Tragic $50,247 |
| Haitians | 0.8 /100 | #262 | Tragic $50,231 |
| Immigrants | Dominican Republic | 0.8 /100 | #263 | Tragic $50,204 |
| Fijians | 0.6 /100 | #264 | Tragic $50,132 |
| Belgians | 0.6 /100 | #265 | Tragic $50,113 |
| Immigrants | Venezuela | 0.6 /100 | #266 | Tragic $50,109 |
| Immigrants | Laos | 0.5 /100 | #267 | Tragic $50,041 |
| Venezuelans | 0.5 /100 | #268 | Tragic $50,011 |
| Ute | 0.5 /100 | #269 | Tragic $49,997 |
| Mexicans | 0.5 /100 | #270 | Tragic $49,989 |
| Taiwanese | 0.3 /100 | #271 | Tragic $49,804 |
| Colville | 0.3 /100 | #272 | Tragic $49,774 |
| Slovaks | 0.3 /100 | #273 | Tragic $49,753 |
| Immigrants | Senegal | 0.3 /100 | #274 | Tragic $49,742 |
Demographics Similar to Immigrants from Ireland by Householder Income Under 25 years
In terms of householder income under 25 years, the demographic groups most similar to Immigrants from Ireland are Immigrants from Fiji ($57,074, a difference of 0.0%), Bhutanese ($57,078, a difference of 0.010%), Immigrants from Eastern Asia ($57,123, a difference of 0.080%), Asian ($57,003, a difference of 0.13%), and Tongan ($56,972, a difference of 0.18%).
| Demographics | Rating | Rank | Householder Income Under 25 years |
| Immigrants | South Central Asia | 100.0 /100 | #13 | Exceptional $57,818 |
| Filipinos | 100.0 /100 | #14 | Exceptional $57,740 |
| Koreans | 100.0 /100 | #15 | Exceptional $57,730 |
| Immigrants | Afghanistan | 100.0 /100 | #16 | Exceptional $57,478 |
| Sierra Leoneans | 100.0 /100 | #17 | Exceptional $57,272 |
| Immigrants | Eastern Asia | 100.0 /100 | #18 | Exceptional $57,123 |
| Bhutanese | 100.0 /100 | #19 | Exceptional $57,078 |
| Immigrants | Ireland | 100.0 /100 | #20 | Exceptional $57,075 |
| Immigrants | Fiji | 100.0 /100 | #21 | Exceptional $57,074 |
| Asians | 100.0 /100 | #22 | Exceptional $57,003 |
| Tongans | 100.0 /100 | #23 | Exceptional $56,972 |
| Immigrants | Singapore | 100.0 /100 | #24 | Exceptional $56,835 |
| Immigrants | Pakistan | 100.0 /100 | #25 | Exceptional $56,789 |
| Immigrants | Australia | 100.0 /100 | #26 | Exceptional $56,660 |
| Immigrants | North Macedonia | 100.0 /100 | #27 | Exceptional $56,503 |