Immigrants from India vs Thai Median Household Income
COMPARE
Immigrants from India
Thai
Median Household Income
Median Household Income Comparison
Immigrants from India
Thais
$113,009
MEDIAN HOUSEHOLD INCOME
100.0/ 100
METRIC RATING
3rd/ 347
METRIC RANK
$110,648
MEDIAN HOUSEHOLD INCOME
100.0/ 100
METRIC RATING
5th/ 347
METRIC RANK
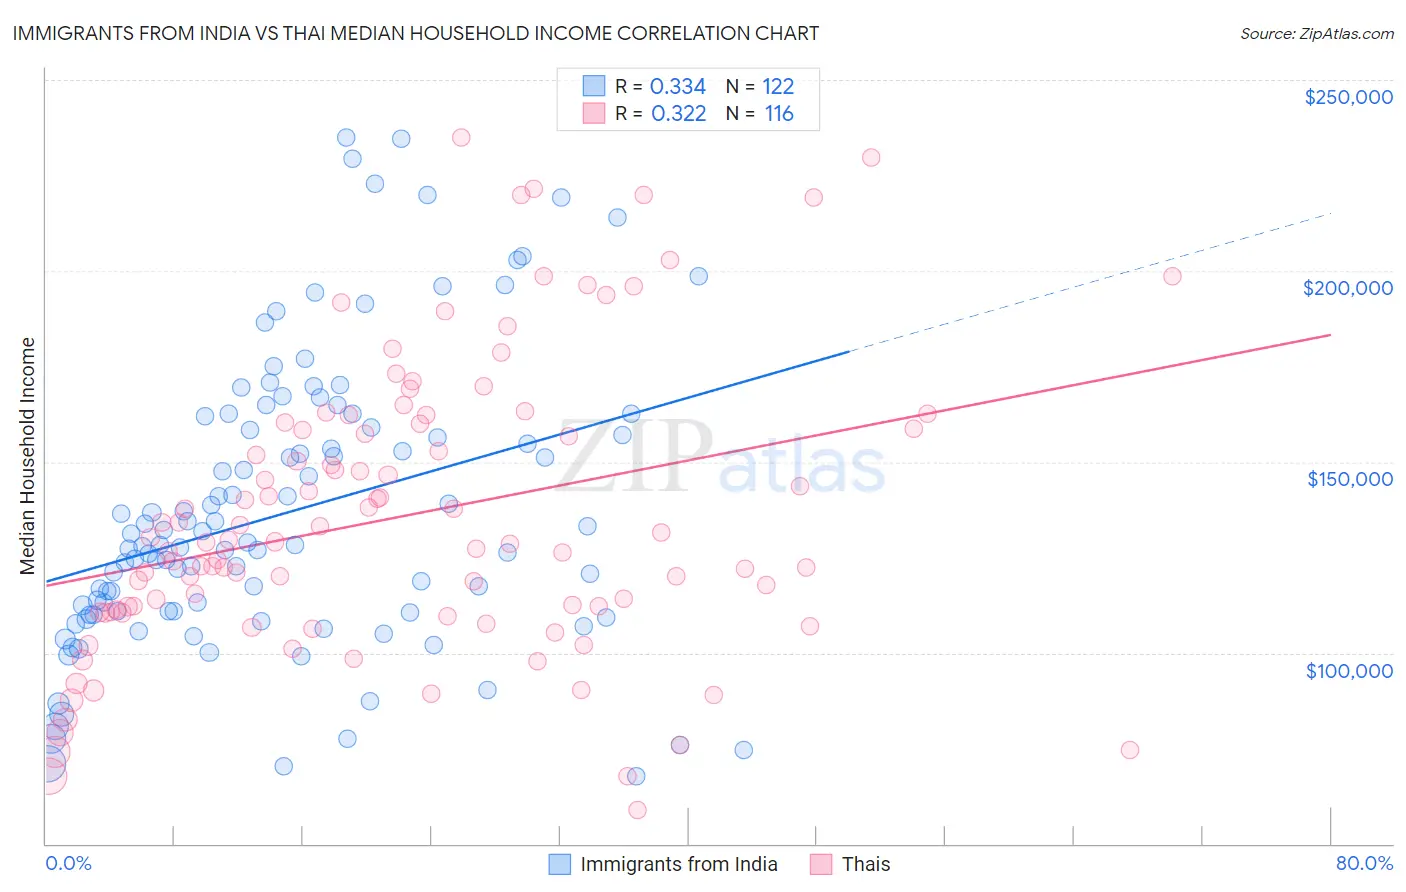
Immigrants from India vs Thai Median Household Income Correlation Chart
The statistical analysis conducted on geographies consisting of 433,644,009 people shows a mild positive correlation between the proportion of Immigrants from India and median household income in the United States with a correlation coefficient (R) of 0.334 and weighted average of $113,009. Similarly, the statistical analysis conducted on geographies consisting of 475,225,518 people shows a mild positive correlation between the proportion of Thais and median household income in the United States with a correlation coefficient (R) of 0.322 and weighted average of $110,648, a difference of 2.1%.
Median Household Income Correlation Summary
| Measurement | Immigrants from India | Thai |
| Minimum | $67,645 | $58,750 |
| Maximum | $235,000 | $235,000 |
| Range | $167,355 | $176,250 |
| Mean | $136,655 | $135,684 |
| Median | $128,100 | $129,000 |
| Interquartile 25% (IQ1) | $110,458 | $110,676 |
| Interquartile 75% (IQ3) | $158,899 | $159,273 |
| Interquartile Range (IQR) | $48,441 | $48,596 |
| Standard Deviation (Sample) | $37,841 | $37,863 |
| Standard Deviation (Population) | $37,686 | $37,700 |
Demographics Similar to Immigrants from India and Thais by Median Household Income
In terms of median household income, the demographic groups most similar to Immigrants from India are Immigrants from Hong Kong ($111,519, a difference of 1.3%), Filipino ($115,509, a difference of 2.2%), Immigrants from Singapore ($110,428, a difference of 2.3%), Iranian ($109,835, a difference of 2.9%), and Immigrants from Taiwan ($116,460, a difference of 3.0%). Similarly, the demographic groups most similar to Thais are Immigrants from Singapore ($110,428, a difference of 0.20%), Iranian ($109,835, a difference of 0.74%), Immigrants from Hong Kong ($111,519, a difference of 0.79%), Immigrants from Iran ($108,055, a difference of 2.4%), and Okinawan ($106,624, a difference of 3.8%).
| Demographics | Rating | Rank | Median Household Income |
| Immigrants | Taiwan | 100.0 /100 | #1 | Exceptional $116,460 |
| Filipinos | 100.0 /100 | #2 | Exceptional $115,509 |
| Immigrants | India | 100.0 /100 | #3 | Exceptional $113,009 |
| Immigrants | Hong Kong | 100.0 /100 | #4 | Exceptional $111,519 |
| Thais | 100.0 /100 | #5 | Exceptional $110,648 |
| Immigrants | Singapore | 100.0 /100 | #6 | Exceptional $110,428 |
| Iranians | 100.0 /100 | #7 | Exceptional $109,835 |
| Immigrants | Iran | 100.0 /100 | #8 | Exceptional $108,055 |
| Okinawans | 100.0 /100 | #9 | Exceptional $106,624 |
| Immigrants | South Central Asia | 100.0 /100 | #10 | Exceptional $106,057 |
| Immigrants | China | 100.0 /100 | #11 | Exceptional $105,335 |
| Indians (Asian) | 100.0 /100 | #12 | Exceptional $105,262 |
| Immigrants | Eastern Asia | 100.0 /100 | #13 | Exceptional $104,796 |
| Immigrants | Ireland | 100.0 /100 | #14 | Exceptional $104,692 |
| Immigrants | Israel | 100.0 /100 | #15 | Exceptional $104,090 |
| Burmese | 100.0 /100 | #16 | Exceptional $103,145 |
| Immigrants | Korea | 100.0 /100 | #17 | Exceptional $102,962 |
| Cypriots | 100.0 /100 | #18 | Exceptional $102,843 |
| Immigrants | Australia | 100.0 /100 | #19 | Exceptional $102,562 |
| Bolivians | 100.0 /100 | #20 | Exceptional $102,195 |