Immigrants from Ghana vs Laotian Householder Income Ages 45 - 64 years
COMPARE
Immigrants from Ghana
Laotian
Householder Income Ages 45 - 64 years
Householder Income Ages 45 - 64 years Comparison
Immigrants from Ghana
Laotians
$94,982
HOUSEHOLDER INCOME AGES 45 - 64 YEARS
6.4/ 100
METRIC RATING
217th/ 347
METRIC RANK
$111,051
HOUSEHOLDER INCOME AGES 45 - 64 YEARS
99.5/ 100
METRIC RATING
67th/ 347
METRIC RANK
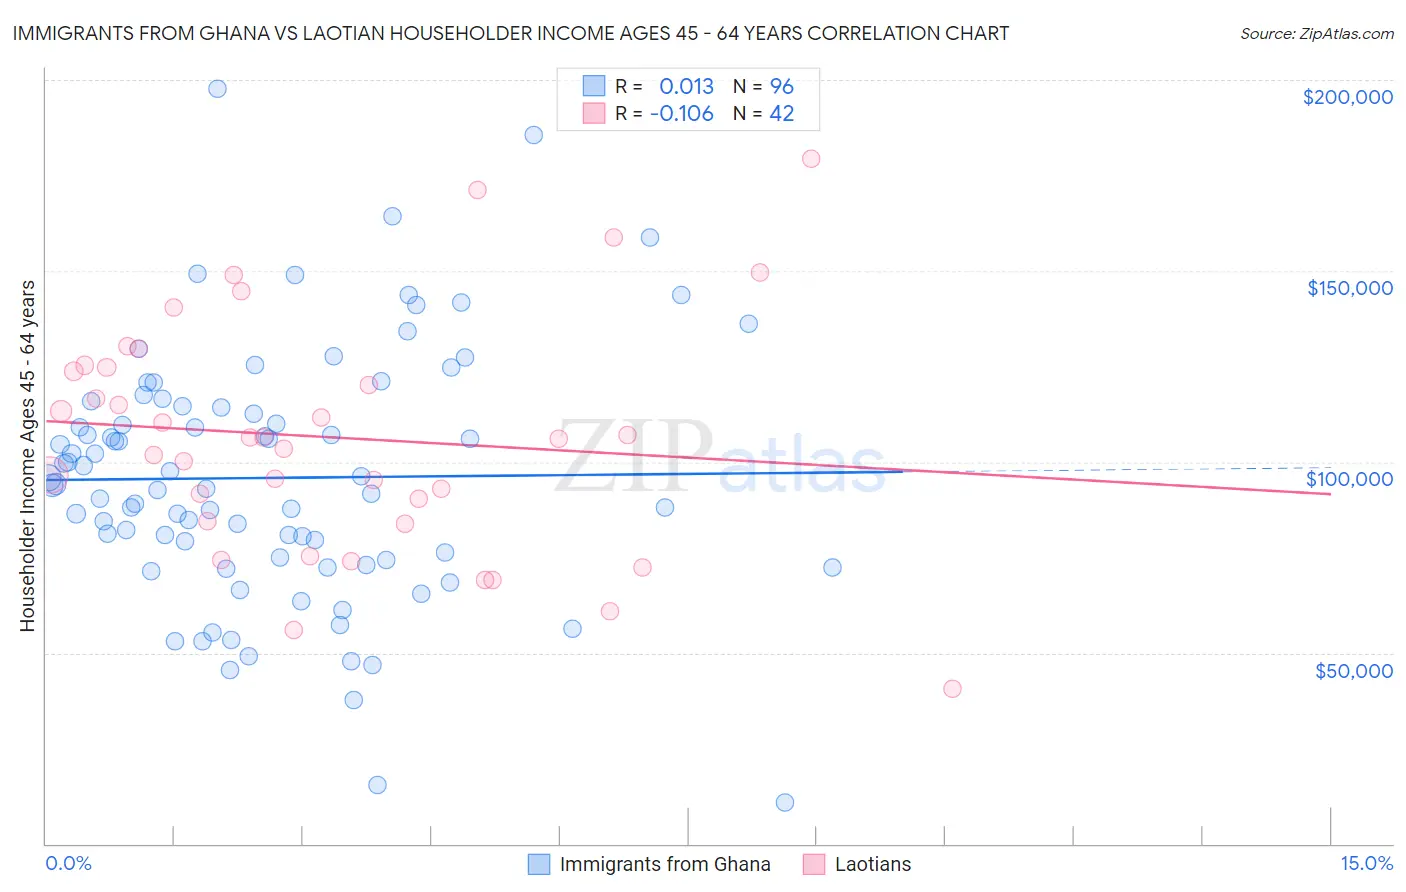
Immigrants from Ghana vs Laotian Householder Income Ages 45 - 64 years Correlation Chart
The statistical analysis conducted on geographies consisting of 199,704,082 people shows no correlation between the proportion of Immigrants from Ghana and household income with householder between the ages 45 and 64 in the United States with a correlation coefficient (R) of 0.013 and weighted average of $94,982. Similarly, the statistical analysis conducted on geographies consisting of 224,613,434 people shows a poor negative correlation between the proportion of Laotians and household income with householder between the ages 45 and 64 in the United States with a correlation coefficient (R) of -0.106 and weighted average of $111,051, a difference of 16.9%.
Householder Income Ages 45 - 64 years Correlation Summary
| Measurement | Immigrants from Ghana | Laotian |
| Minimum | $10,938 | $40,547 |
| Maximum | $197,851 | $179,286 |
| Range | $186,913 | $138,739 |
| Mean | $95,814 | $106,378 |
| Median | $94,054 | $106,231 |
| Interquartile 25% (IQ1) | $74,592 | $84,487 |
| Interquartile 75% (IQ3) | $114,445 | $124,834 |
| Interquartile Range (IQR) | $39,852 | $40,347 |
| Standard Deviation (Sample) | $33,020 | $30,879 |
| Standard Deviation (Population) | $32,848 | $30,509 |
Similar Demographics by Householder Income Ages 45 - 64 years
Demographics Similar to Immigrants from Ghana by Householder Income Ages 45 - 64 years
In terms of householder income ages 45 - 64 years, the demographic groups most similar to Immigrants from Ghana are Delaware ($94,914, a difference of 0.070%), Immigrants from Armenia ($94,863, a difference of 0.13%), Salvadoran ($94,842, a difference of 0.15%), Immigrants from Nigeria ($94,804, a difference of 0.19%), and Immigrants from Venezuela ($95,342, a difference of 0.38%).
| Demographics | Rating | Rank | Householder Income Ages 45 - 64 years |
| Tsimshian | 14.5 /100 | #210 | Poor $96,783 |
| Immigrants | Cambodia | 13.0 /100 | #211 | Poor $96,537 |
| Venezuelans | 12.6 /100 | #212 | Poor $96,460 |
| Immigrants | Uruguay | 10.7 /100 | #213 | Poor $96,086 |
| Panamanians | 10.6 /100 | #214 | Poor $96,066 |
| Nigerians | 8.2 /100 | #215 | Tragic $95,492 |
| Immigrants | Venezuela | 7.6 /100 | #216 | Tragic $95,342 |
| Immigrants | Ghana | 6.4 /100 | #217 | Tragic $94,982 |
| Delaware | 6.2 /100 | #218 | Tragic $94,914 |
| Immigrants | Armenia | 6.1 /100 | #219 | Tragic $94,863 |
| Salvadorans | 6.0 /100 | #220 | Tragic $94,842 |
| Immigrants | Nigeria | 5.9 /100 | #221 | Tragic $94,804 |
| Malaysians | 5.2 /100 | #222 | Tragic $94,517 |
| Immigrants | Nonimmigrants | 5.0 /100 | #223 | Tragic $94,448 |
| Immigrants | Bosnia and Herzegovina | 4.6 /100 | #224 | Tragic $94,288 |
Demographics Similar to Laotians by Householder Income Ages 45 - 64 years
In terms of householder income ages 45 - 64 years, the demographic groups most similar to Laotians are New Zealander ($111,286, a difference of 0.21%), Immigrants from Belarus ($111,430, a difference of 0.34%), Immigrants from Latvia ($111,454, a difference of 0.36%), Immigrants from Romania ($110,633, a difference of 0.38%), and Mongolian ($111,602, a difference of 0.50%).
| Demographics | Rating | Rank | Householder Income Ages 45 - 64 years |
| Immigrants | Netherlands | 99.7 /100 | #60 | Exceptional $111,982 |
| Immigrants | Czechoslovakia | 99.7 /100 | #61 | Exceptional $111,914 |
| Immigrants | Norway | 99.7 /100 | #62 | Exceptional $111,669 |
| Mongolians | 99.6 /100 | #63 | Exceptional $111,602 |
| Immigrants | Latvia | 99.6 /100 | #64 | Exceptional $111,454 |
| Immigrants | Belarus | 99.6 /100 | #65 | Exceptional $111,430 |
| New Zealanders | 99.6 /100 | #66 | Exceptional $111,286 |
| Laotians | 99.5 /100 | #67 | Exceptional $111,051 |
| Immigrants | Romania | 99.4 /100 | #68 | Exceptional $110,633 |
| Immigrants | Italy | 99.4 /100 | #69 | Exceptional $110,434 |
| Koreans | 99.3 /100 | #70 | Exceptional $110,334 |
| Italians | 99.3 /100 | #71 | Exceptional $110,224 |
| Assyrians/Chaldeans/Syriacs | 99.3 /100 | #72 | Exceptional $110,201 |
| Argentineans | 99.3 /100 | #73 | Exceptional $110,103 |
| Immigrants | Egypt | 99.2 /100 | #74 | Exceptional $109,941 |