Argentinean vs Immigrants from Moldova Median Family Income
COMPARE
Argentinean
Immigrants from Moldova
Median Family Income
Median Family Income Comparison
Argentineans
Immigrants from Moldova
$112,665
MEDIAN FAMILY INCOME
99.4/ 100
METRIC RATING
76th/ 347
METRIC RANK
$109,975
MEDIAN FAMILY INCOME
97.7/ 100
METRIC RATING
96th/ 347
METRIC RANK
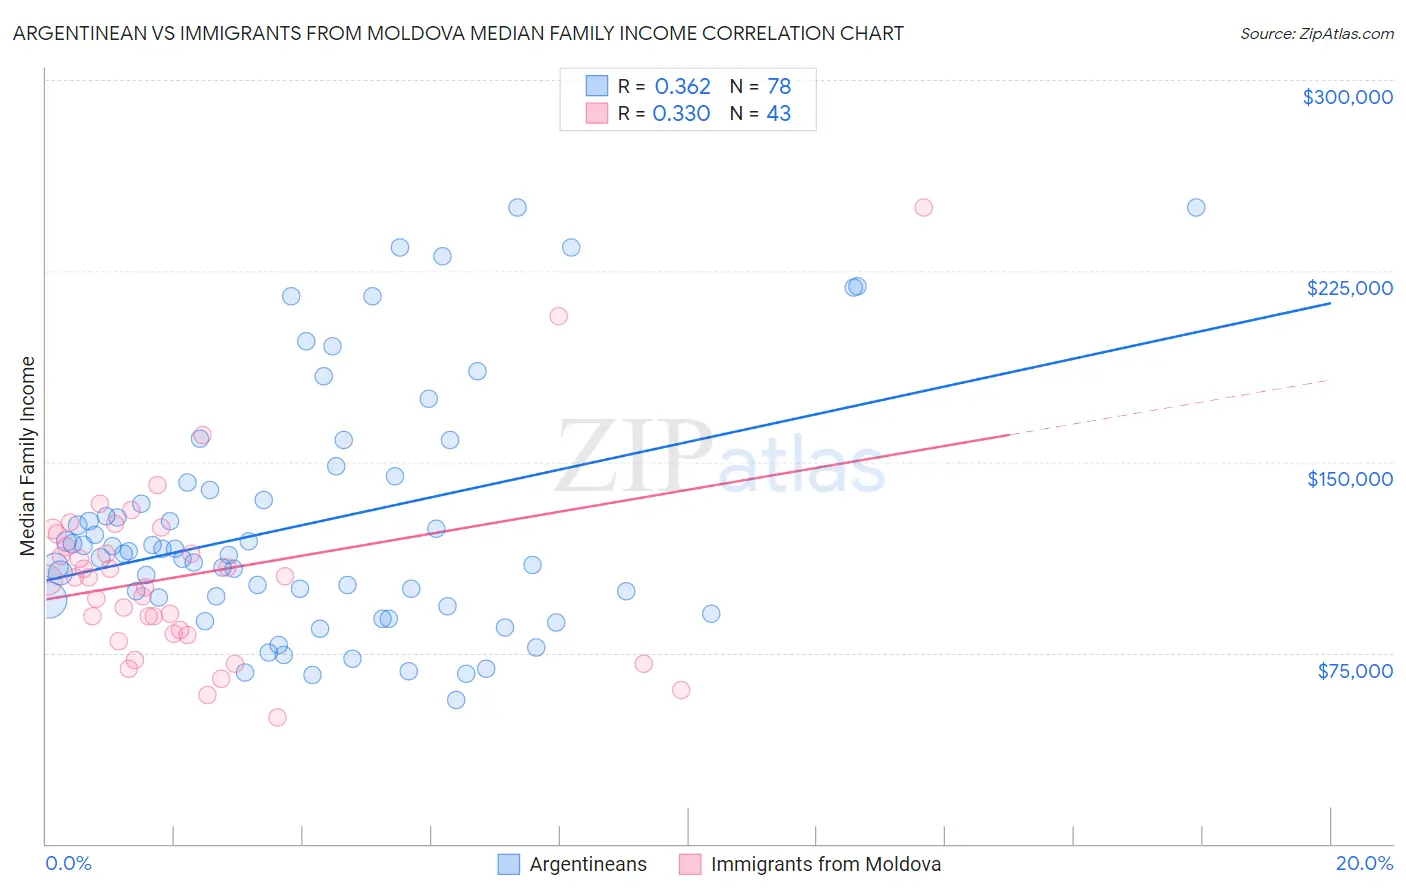
Argentinean vs Immigrants from Moldova Median Family Income Correlation Chart
The statistical analysis conducted on geographies consisting of 296,932,398 people shows a mild positive correlation between the proportion of Argentineans and median family income in the United States with a correlation coefficient (R) of 0.362 and weighted average of $112,665. Similarly, the statistical analysis conducted on geographies consisting of 124,358,975 people shows a mild positive correlation between the proportion of Immigrants from Moldova and median family income in the United States with a correlation coefficient (R) of 0.330 and weighted average of $109,975, a difference of 2.5%.
Median Family Income Correlation Summary
| Measurement | Argentinean | Immigrants from Moldova |
| Minimum | $56,696 | $49,474 |
| Maximum | $250,001 | $250,001 |
| Range | $193,305 | $200,527 |
| Mean | $126,035 | $105,716 |
| Median | $114,562 | $104,398 |
| Interquartile 25% (IQ1) | $95,780 | $82,625 |
| Interquartile 75% (IQ3) | $141,982 | $121,587 |
| Interquartile Range (IQR) | $46,202 | $38,962 |
| Standard Deviation (Sample) | $48,159 | $36,710 |
| Standard Deviation (Population) | $47,849 | $36,280 |
Demographics Similar to Argentineans and Immigrants from Moldova by Median Family Income
In terms of median family income, the demographic groups most similar to Argentineans are Immigrants from Eastern Europe ($112,527, a difference of 0.12%), Immigrants from Canada ($112,374, a difference of 0.26%), Italian ($112,372, a difference of 0.26%), Immigrants from Croatia ($112,323, a difference of 0.30%), and Immigrants from North America ($112,151, a difference of 0.46%). Similarly, the demographic groups most similar to Immigrants from Moldova are Zimbabwean ($110,011, a difference of 0.030%), Korean ($110,103, a difference of 0.12%), Immigrants from Kazakhstan ($110,137, a difference of 0.15%), Immigrants from Lebanon ($110,159, a difference of 0.17%), and Immigrants from Southern Europe ($110,614, a difference of 0.58%).
| Demographics | Rating | Rank | Median Family Income |
| Argentineans | 99.4 /100 | #76 | Exceptional $112,665 |
| Immigrants | Eastern Europe | 99.4 /100 | #77 | Exceptional $112,527 |
| Immigrants | Canada | 99.3 /100 | #78 | Exceptional $112,374 |
| Italians | 99.3 /100 | #79 | Exceptional $112,372 |
| Immigrants | Croatia | 99.3 /100 | #80 | Exceptional $112,323 |
| Immigrants | North America | 99.2 /100 | #81 | Exceptional $112,151 |
| Immigrants | England | 99.2 /100 | #82 | Exceptional $112,038 |
| Immigrants | Egypt | 99.0 /100 | #83 | Exceptional $111,689 |
| Immigrants | Hungary | 98.8 /100 | #84 | Exceptional $111,378 |
| Croatians | 98.8 /100 | #85 | Exceptional $111,370 |
| Ukrainians | 98.8 /100 | #86 | Exceptional $111,368 |
| Austrians | 98.8 /100 | #87 | Exceptional $111,306 |
| Romanians | 98.8 /100 | #88 | Exceptional $111,243 |
| Immigrants | Argentina | 98.5 /100 | #89 | Exceptional $110,873 |
| Northern Europeans | 98.3 /100 | #90 | Exceptional $110,635 |
| Immigrants | Southern Europe | 98.3 /100 | #91 | Exceptional $110,614 |
| Immigrants | Lebanon | 97.9 /100 | #92 | Exceptional $110,159 |
| Immigrants | Kazakhstan | 97.8 /100 | #93 | Exceptional $110,137 |
| Koreans | 97.8 /100 | #94 | Exceptional $110,103 |
| Zimbabweans | 97.7 /100 | #95 | Exceptional $110,011 |
| Immigrants | Moldova | 97.7 /100 | #96 | Exceptional $109,975 |