Immigrants from England vs British Householder Income Ages 45 - 64 years
COMPARE
Immigrants from England
British
Householder Income Ages 45 - 64 years
Householder Income Ages 45 - 64 years Comparison
Immigrants from England
British
$109,446
HOUSEHOLDER INCOME AGES 45 - 64 YEARS
99.0/ 100
METRIC RATING
77th/ 347
METRIC RANK
$106,264
HOUSEHOLDER INCOME AGES 45 - 64 YEARS
95.2/ 100
METRIC RATING
116th/ 347
METRIC RANK
Immigrants from England vs British Householder Income Ages 45 - 64 years Correlation Chart
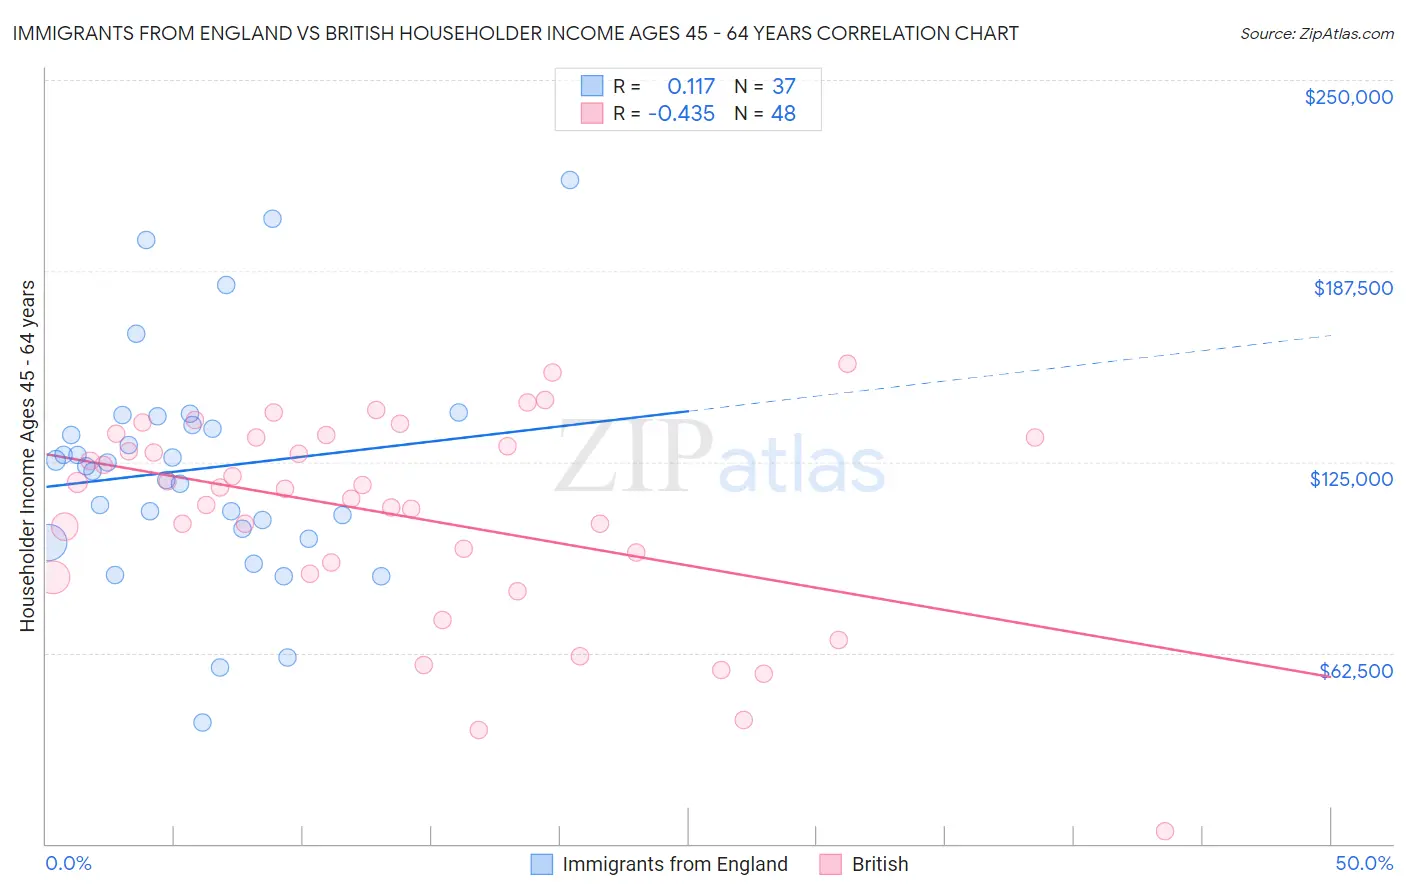
The statistical analysis conducted on geographies consisting of 391,386,489 people shows a poor positive correlation between the proportion of Immigrants from England and household income with householder between the ages 45 and 64 in the United States with a correlation coefficient (R) of 0.117 and weighted average of $109,446. Similarly, the statistical analysis conducted on geographies consisting of 529,409,230 people shows a moderate negative correlation between the proportion of British and household income with householder between the ages 45 and 64 in the United States with a correlation coefficient (R) of -0.435 and weighted average of $106,264, a difference of 3.0%.
Householder Income Ages 45 - 64 years Correlation Summary
| Measurement | Immigrants from England | British |
| Minimum | $39,802 | $3,946 |
| Maximum | $217,188 | $157,159 |
| Range | $177,386 | $153,213 |
| Mean | $122,668 | $107,499 |
| Median | $123,541 | $116,378 |
| Interquartile 25% (IQ1) | $101,375 | $90,097 |
| Interquartile 75% (IQ3) | $138,511 | $132,967 |
| Interquartile Range (IQR) | $37,136 | $42,871 |
| Standard Deviation (Sample) | $37,553 | $33,617 |
| Standard Deviation (Population) | $37,042 | $33,265 |
Similar Demographics by Householder Income Ages 45 - 64 years
Demographics Similar to Immigrants from England by Householder Income Ages 45 - 64 years
In terms of householder income ages 45 - 64 years, the demographic groups most similar to Immigrants from England are Paraguayan ($109,447, a difference of 0.0%), Immigrants from Canada ($109,402, a difference of 0.040%), Immigrants from Bulgaria ($109,379, a difference of 0.060%), Jordanian ($109,376, a difference of 0.060%), and Immigrants from Eastern Europe ($109,335, a difference of 0.10%).
| Demographics | Rating | Rank | Householder Income Ages 45 - 64 years |
| Koreans | 99.3 /100 | #70 | Exceptional $110,334 |
| Italians | 99.3 /100 | #71 | Exceptional $110,224 |
| Assyrians/Chaldeans/Syriacs | 99.3 /100 | #72 | Exceptional $110,201 |
| Argentineans | 99.3 /100 | #73 | Exceptional $110,103 |
| Immigrants | Egypt | 99.2 /100 | #74 | Exceptional $109,941 |
| South Africans | 99.1 /100 | #75 | Exceptional $109,719 |
| Paraguayans | 99.0 /100 | #76 | Exceptional $109,447 |
| Immigrants | England | 99.0 /100 | #77 | Exceptional $109,446 |
| Immigrants | Canada | 99.0 /100 | #78 | Exceptional $109,402 |
| Immigrants | Bulgaria | 98.9 /100 | #79 | Exceptional $109,379 |
| Jordanians | 98.9 /100 | #80 | Exceptional $109,376 |
| Immigrants | Eastern Europe | 98.9 /100 | #81 | Exceptional $109,335 |
| Immigrants | North America | 98.8 /100 | #82 | Exceptional $109,198 |
| Immigrants | Spain | 98.8 /100 | #83 | Exceptional $109,051 |
| Immigrants | Western Europe | 98.6 /100 | #84 | Exceptional $108,824 |
Demographics Similar to British by Householder Income Ages 45 - 64 years
In terms of householder income ages 45 - 64 years, the demographic groups most similar to British are Immigrants from Kuwait ($106,285, a difference of 0.020%), Albanian ($106,243, a difference of 0.020%), Immigrants from Western Asia ($106,217, a difference of 0.040%), Immigrants from Poland ($106,319, a difference of 0.050%), and Immigrants from Jordan ($106,164, a difference of 0.090%).
| Demographics | Rating | Rank | Householder Income Ages 45 - 64 years |
| Chileans | 95.9 /100 | #109 | Exceptional $106,611 |
| Immigrants | Brazil | 95.6 /100 | #110 | Exceptional $106,470 |
| Immigrants | Vietnam | 95.5 /100 | #111 | Exceptional $106,417 |
| Swedes | 95.4 /100 | #112 | Exceptional $106,377 |
| Europeans | 95.4 /100 | #113 | Exceptional $106,367 |
| Immigrants | Poland | 95.3 /100 | #114 | Exceptional $106,319 |
| Immigrants | Kuwait | 95.2 /100 | #115 | Exceptional $106,285 |
| British | 95.2 /100 | #116 | Exceptional $106,264 |
| Albanians | 95.1 /100 | #117 | Exceptional $106,243 |
| Immigrants | Western Asia | 95.0 /100 | #118 | Exceptional $106,217 |
| Immigrants | Jordan | 94.9 /100 | #119 | Exceptional $106,164 |
| Immigrants | South Eastern Asia | 94.8 /100 | #120 | Exceptional $106,109 |
| Poles | 94.4 /100 | #121 | Exceptional $105,952 |
| Immigrants | North Macedonia | 94.2 /100 | #122 | Exceptional $105,892 |
| Danes | 93.4 /100 | #123 | Exceptional $105,619 |