Immigrants from Jamaica vs British Householder Income Ages 45 - 64 years
COMPARE
Immigrants from Jamaica
British
Householder Income Ages 45 - 64 years
Householder Income Ages 45 - 64 years Comparison
Immigrants from Jamaica
British
$87,035
HOUSEHOLDER INCOME AGES 45 - 64 YEARS
0.1/ 100
METRIC RATING
278th/ 347
METRIC RANK
$106,264
HOUSEHOLDER INCOME AGES 45 - 64 YEARS
95.2/ 100
METRIC RATING
116th/ 347
METRIC RANK
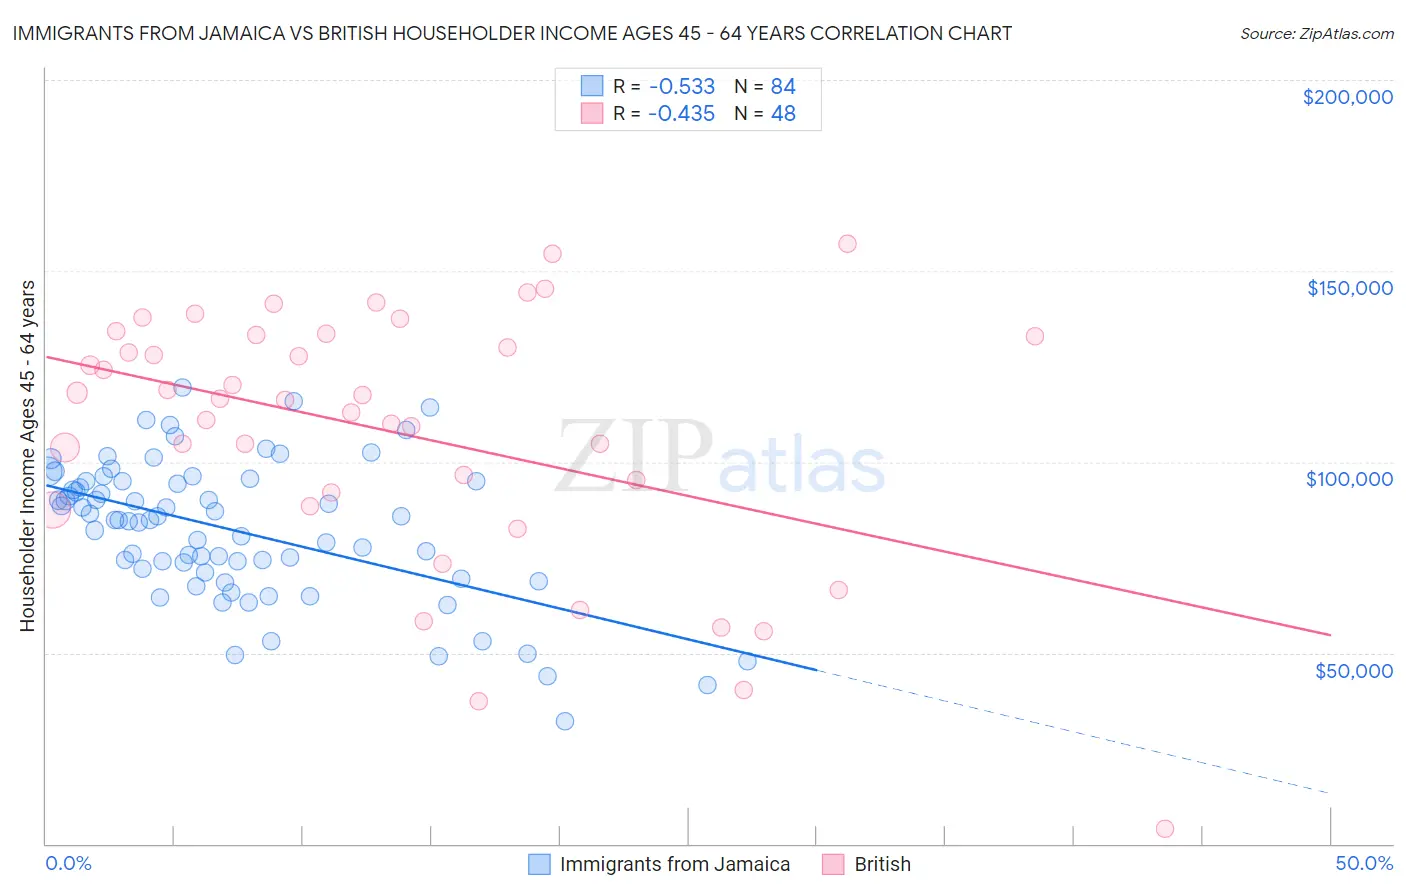
Immigrants from Jamaica vs British Householder Income Ages 45 - 64 years Correlation Chart
The statistical analysis conducted on geographies consisting of 301,245,641 people shows a substantial negative correlation between the proportion of Immigrants from Jamaica and household income with householder between the ages 45 and 64 in the United States with a correlation coefficient (R) of -0.533 and weighted average of $87,035. Similarly, the statistical analysis conducted on geographies consisting of 529,409,230 people shows a moderate negative correlation between the proportion of British and household income with householder between the ages 45 and 64 in the United States with a correlation coefficient (R) of -0.435 and weighted average of $106,264, a difference of 22.1%.
Householder Income Ages 45 - 64 years Correlation Summary
| Measurement | Immigrants from Jamaica | British |
| Minimum | $31,923 | $3,946 |
| Maximum | $119,503 | $157,159 |
| Range | $87,580 | $153,213 |
| Mean | $82,100 | $107,499 |
| Median | $84,769 | $116,378 |
| Interquartile 25% (IQ1) | $71,502 | $90,097 |
| Interquartile 75% (IQ3) | $94,805 | $132,967 |
| Interquartile Range (IQR) | $23,303 | $42,871 |
| Standard Deviation (Sample) | $18,162 | $33,617 |
| Standard Deviation (Population) | $18,054 | $33,265 |
Similar Demographics by Householder Income Ages 45 - 64 years
Demographics Similar to Immigrants from Jamaica by Householder Income Ages 45 - 64 years
In terms of householder income ages 45 - 64 years, the demographic groups most similar to Immigrants from Jamaica are Yakama ($86,992, a difference of 0.050%), Immigrants from Somalia ($86,987, a difference of 0.050%), Yaqui ($86,914, a difference of 0.14%), Senegalese ($86,897, a difference of 0.16%), and Cree ($87,185, a difference of 0.17%).
| Demographics | Rating | Rank | Householder Income Ages 45 - 64 years |
| Guatemalans | 0.2 /100 | #271 | Tragic $87,705 |
| Cape Verdeans | 0.2 /100 | #272 | Tragic $87,580 |
| Spanish American Indians | 0.2 /100 | #273 | Tragic $87,561 |
| Iroquois | 0.1 /100 | #274 | Tragic $87,255 |
| Immigrants | Belize | 0.1 /100 | #275 | Tragic $87,229 |
| Immigrants | Latin America | 0.1 /100 | #276 | Tragic $87,219 |
| Cree | 0.1 /100 | #277 | Tragic $87,185 |
| Immigrants | Jamaica | 0.1 /100 | #278 | Tragic $87,035 |
| Yakama | 0.1 /100 | #279 | Tragic $86,992 |
| Immigrants | Somalia | 0.1 /100 | #280 | Tragic $86,987 |
| Yaqui | 0.1 /100 | #281 | Tragic $86,914 |
| Senegalese | 0.1 /100 | #282 | Tragic $86,897 |
| Mexicans | 0.1 /100 | #283 | Tragic $86,816 |
| Central American Indians | 0.1 /100 | #284 | Tragic $86,764 |
| Blackfeet | 0.1 /100 | #285 | Tragic $86,595 |
Demographics Similar to British by Householder Income Ages 45 - 64 years
In terms of householder income ages 45 - 64 years, the demographic groups most similar to British are Immigrants from Kuwait ($106,285, a difference of 0.020%), Albanian ($106,243, a difference of 0.020%), Immigrants from Western Asia ($106,217, a difference of 0.040%), Immigrants from Poland ($106,319, a difference of 0.050%), and Immigrants from Jordan ($106,164, a difference of 0.090%).
| Demographics | Rating | Rank | Householder Income Ages 45 - 64 years |
| Chileans | 95.9 /100 | #109 | Exceptional $106,611 |
| Immigrants | Brazil | 95.6 /100 | #110 | Exceptional $106,470 |
| Immigrants | Vietnam | 95.5 /100 | #111 | Exceptional $106,417 |
| Swedes | 95.4 /100 | #112 | Exceptional $106,377 |
| Europeans | 95.4 /100 | #113 | Exceptional $106,367 |
| Immigrants | Poland | 95.3 /100 | #114 | Exceptional $106,319 |
| Immigrants | Kuwait | 95.2 /100 | #115 | Exceptional $106,285 |
| British | 95.2 /100 | #116 | Exceptional $106,264 |
| Albanians | 95.1 /100 | #117 | Exceptional $106,243 |
| Immigrants | Western Asia | 95.0 /100 | #118 | Exceptional $106,217 |
| Immigrants | Jordan | 94.9 /100 | #119 | Exceptional $106,164 |
| Immigrants | South Eastern Asia | 94.8 /100 | #120 | Exceptional $106,109 |
| Poles | 94.4 /100 | #121 | Exceptional $105,952 |
| Immigrants | North Macedonia | 94.2 /100 | #122 | Exceptional $105,892 |
| Danes | 93.4 /100 | #123 | Exceptional $105,619 |