Immigrants from Eastern Europe vs Burmese Median Male Earnings
COMPARE
Immigrants from Eastern Europe
Burmese
Median Male Earnings
Median Male Earnings Comparison
Immigrants from Eastern Europe
Burmese
$60,958
MEDIAN MALE EARNINGS
99.8/ 100
METRIC RATING
64th/ 347
METRIC RANK
$65,236
MEDIAN MALE EARNINGS
100.0/ 100
METRIC RATING
22nd/ 347
METRIC RANK
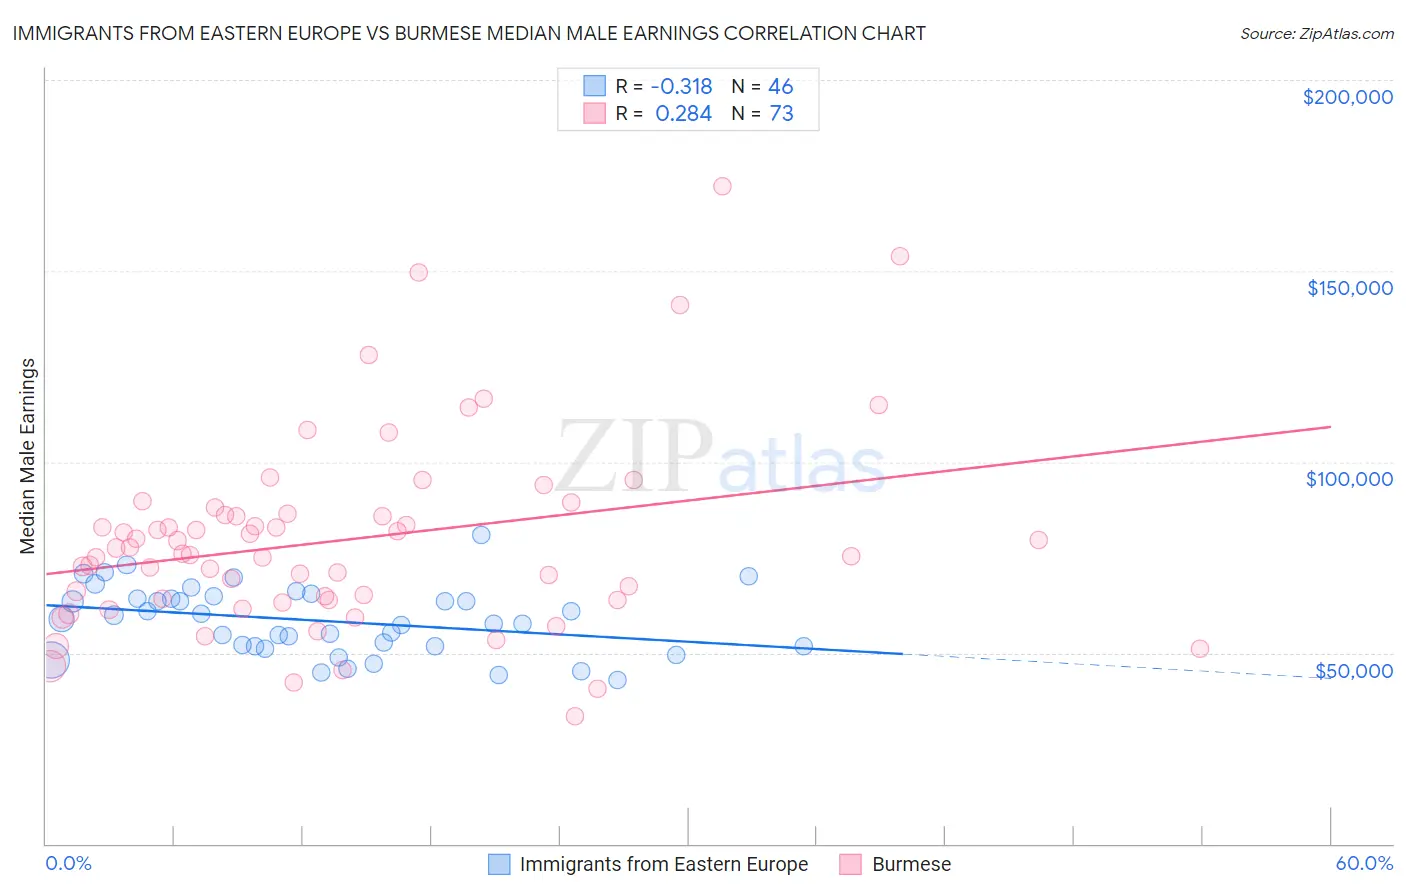
Immigrants from Eastern Europe vs Burmese Median Male Earnings Correlation Chart
The statistical analysis conducted on geographies consisting of 475,591,188 people shows a mild negative correlation between the proportion of Immigrants from Eastern Europe and median male earnings in the United States with a correlation coefficient (R) of -0.318 and weighted average of $60,958. Similarly, the statistical analysis conducted on geographies consisting of 465,224,564 people shows a weak positive correlation between the proportion of Burmese and median male earnings in the United States with a correlation coefficient (R) of 0.284 and weighted average of $65,236, a difference of 7.0%.
Median Male Earnings Correlation Summary
| Measurement | Immigrants from Eastern Europe | Burmese |
| Minimum | $43,003 | $33,399 |
| Maximum | $80,938 | $172,143 |
| Range | $37,935 | $138,744 |
| Mean | $58,399 | $79,644 |
| Median | $58,206 | $75,943 |
| Interquartile 25% (IQ1) | $51,611 | $63,717 |
| Interquartile 75% (IQ3) | $64,157 | $86,383 |
| Interquartile Range (IQR) | $12,547 | $22,666 |
| Standard Deviation (Sample) | $8,866 | $25,713 |
| Standard Deviation (Population) | $8,769 | $25,536 |
Similar Demographics by Median Male Earnings
Demographics Similar to Immigrants from Eastern Europe by Median Male Earnings
In terms of median male earnings, the demographic groups most similar to Immigrants from Eastern Europe are Immigrants from Indonesia ($60,935, a difference of 0.040%), Immigrants from Pakistan ($60,987, a difference of 0.050%), Immigrants from Croatia ($60,914, a difference of 0.070%), Immigrants from Romania ($61,040, a difference of 0.13%), and Bolivian ($61,066, a difference of 0.18%).
| Demographics | Rating | Rank | Median Male Earnings |
| Immigrants | Scotland | 99.9 /100 | #57 | Exceptional $61,220 |
| New Zealanders | 99.9 /100 | #58 | Exceptional $61,199 |
| Immigrants | Netherlands | 99.8 /100 | #59 | Exceptional $61,096 |
| Egyptians | 99.8 /100 | #60 | Exceptional $61,095 |
| Bolivians | 99.8 /100 | #61 | Exceptional $61,066 |
| Immigrants | Romania | 99.8 /100 | #62 | Exceptional $61,040 |
| Immigrants | Pakistan | 99.8 /100 | #63 | Exceptional $60,987 |
| Immigrants | Eastern Europe | 99.8 /100 | #64 | Exceptional $60,958 |
| Immigrants | Indonesia | 99.8 /100 | #65 | Exceptional $60,935 |
| Immigrants | Croatia | 99.8 /100 | #66 | Exceptional $60,914 |
| Immigrants | Spain | 99.8 /100 | #67 | Exceptional $60,750 |
| Immigrants | Serbia | 99.7 /100 | #68 | Exceptional $60,600 |
| Immigrants | Canada | 99.7 /100 | #69 | Exceptional $60,388 |
| Immigrants | Bulgaria | 99.7 /100 | #70 | Exceptional $60,358 |
| Mongolians | 99.7 /100 | #71 | Exceptional $60,350 |
Demographics Similar to Burmese by Median Male Earnings
In terms of median male earnings, the demographic groups most similar to Burmese are Immigrants from Korea ($65,079, a difference of 0.24%), Immigrants from Sweden ($65,406, a difference of 0.26%), Immigrants from Northern Europe ($64,987, a difference of 0.38%), Immigrants from Japan ($65,518, a difference of 0.43%), and Cypriot ($65,549, a difference of 0.48%).
| Demographics | Rating | Rank | Median Male Earnings |
| Immigrants | Eastern Asia | 100.0 /100 | #15 | Exceptional $66,903 |
| Eastern Europeans | 100.0 /100 | #16 | Exceptional $66,472 |
| Immigrants | Belgium | 100.0 /100 | #17 | Exceptional $66,125 |
| Indians (Asian) | 100.0 /100 | #18 | Exceptional $66,078 |
| Cypriots | 100.0 /100 | #19 | Exceptional $65,549 |
| Immigrants | Japan | 100.0 /100 | #20 | Exceptional $65,518 |
| Immigrants | Sweden | 100.0 /100 | #21 | Exceptional $65,406 |
| Burmese | 100.0 /100 | #22 | Exceptional $65,236 |
| Immigrants | Korea | 100.0 /100 | #23 | Exceptional $65,079 |
| Immigrants | Northern Europe | 100.0 /100 | #24 | Exceptional $64,987 |
| Immigrants | Denmark | 100.0 /100 | #25 | Exceptional $64,625 |
| Turks | 100.0 /100 | #26 | Exceptional $64,253 |
| Immigrants | Switzerland | 100.0 /100 | #27 | Exceptional $63,944 |
| Russians | 100.0 /100 | #28 | Exceptional $63,939 |
| Asians | 100.0 /100 | #29 | Exceptional $63,827 |