Argentinean vs Burmese Median Male Earnings
COMPARE
Argentinean
Burmese
Median Male Earnings
Median Male Earnings Comparison
Argentineans
Burmese
$60,117
MEDIAN MALE EARNINGS
99.6/ 100
METRIC RATING
74th/ 347
METRIC RANK
$65,236
MEDIAN MALE EARNINGS
100.0/ 100
METRIC RATING
22nd/ 347
METRIC RANK
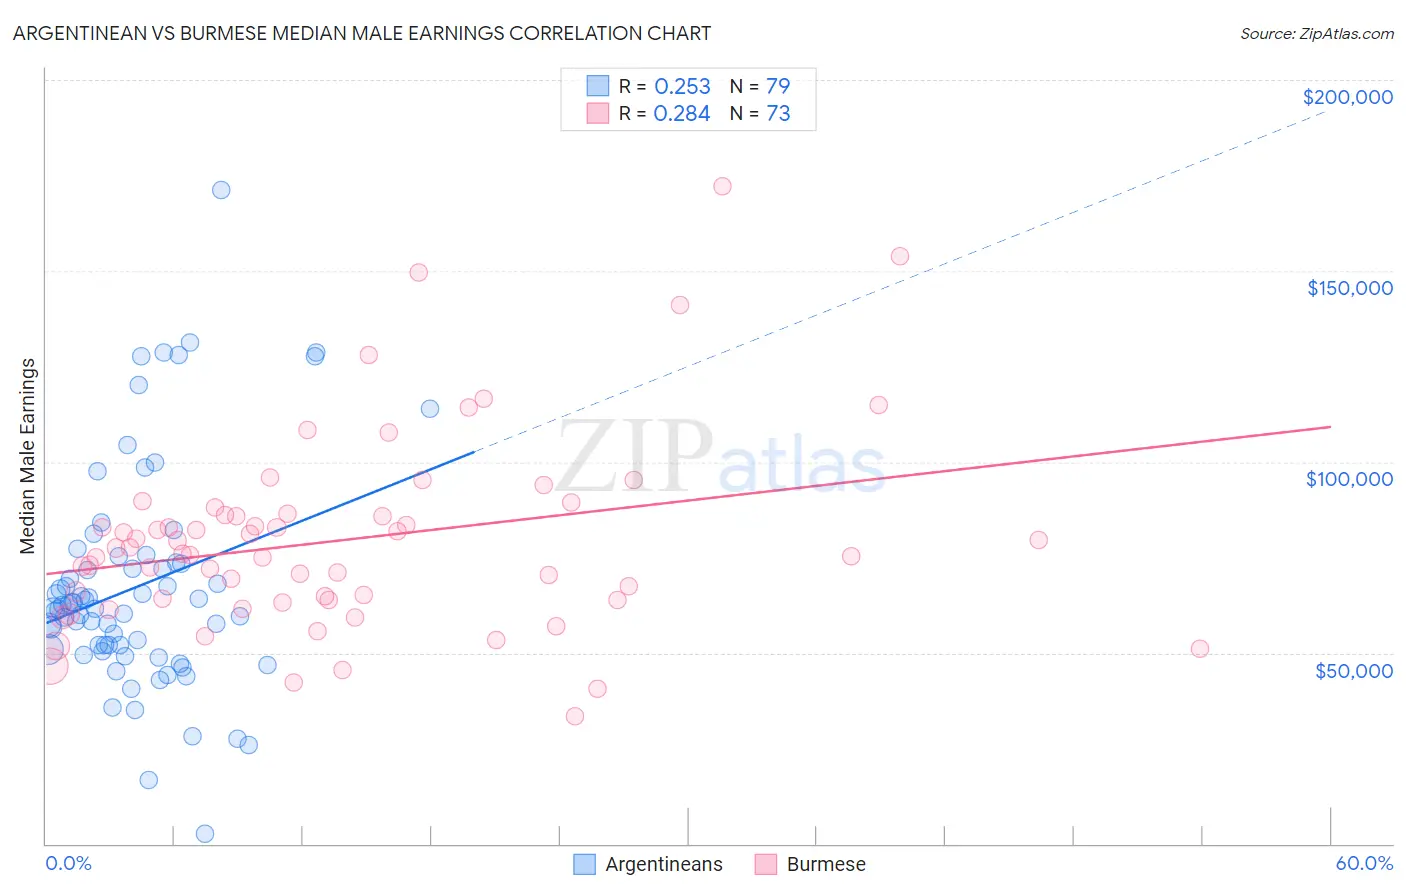
Argentinean vs Burmese Median Male Earnings Correlation Chart
The statistical analysis conducted on geographies consisting of 297,106,472 people shows a weak positive correlation between the proportion of Argentineans and median male earnings in the United States with a correlation coefficient (R) of 0.253 and weighted average of $60,117. Similarly, the statistical analysis conducted on geographies consisting of 465,224,564 people shows a weak positive correlation between the proportion of Burmese and median male earnings in the United States with a correlation coefficient (R) of 0.284 and weighted average of $65,236, a difference of 8.5%.
Median Male Earnings Correlation Summary
| Measurement | Argentinean | Burmese |
| Minimum | $2,499 | $33,399 |
| Maximum | $171,304 | $172,143 |
| Range | $168,805 | $138,744 |
| Mean | $67,306 | $79,644 |
| Median | $61,977 | $75,943 |
| Interquartile 25% (IQ1) | $50,898 | $63,717 |
| Interquartile 75% (IQ3) | $73,533 | $86,383 |
| Interquartile Range (IQR) | $22,635 | $22,666 |
| Standard Deviation (Sample) | $28,973 | $25,713 |
| Standard Deviation (Population) | $28,789 | $25,536 |
Similar Demographics by Median Male Earnings
Demographics Similar to Argentineans by Median Male Earnings
In terms of median male earnings, the demographic groups most similar to Argentineans are Immigrants from Bolivia ($60,088, a difference of 0.050%), Romanian ($60,063, a difference of 0.090%), Paraguayan ($59,975, a difference of 0.24%), Immigrants from North America ($60,265, a difference of 0.25%), and Immigrants from Egypt ($59,925, a difference of 0.32%).
| Demographics | Rating | Rank | Median Male Earnings |
| Immigrants | Spain | 99.8 /100 | #67 | Exceptional $60,750 |
| Immigrants | Serbia | 99.7 /100 | #68 | Exceptional $60,600 |
| Immigrants | Canada | 99.7 /100 | #69 | Exceptional $60,388 |
| Immigrants | Bulgaria | 99.7 /100 | #70 | Exceptional $60,358 |
| Mongolians | 99.7 /100 | #71 | Exceptional $60,350 |
| Immigrants | Western Europe | 99.7 /100 | #72 | Exceptional $60,334 |
| Immigrants | North America | 99.7 /100 | #73 | Exceptional $60,265 |
| Argentineans | 99.6 /100 | #74 | Exceptional $60,117 |
| Immigrants | Bolivia | 99.6 /100 | #75 | Exceptional $60,088 |
| Romanians | 99.6 /100 | #76 | Exceptional $60,063 |
| Paraguayans | 99.5 /100 | #77 | Exceptional $59,975 |
| Immigrants | Egypt | 99.5 /100 | #78 | Exceptional $59,925 |
| Immigrants | Ukraine | 99.5 /100 | #79 | Exceptional $59,820 |
| Immigrants | Hungary | 99.5 /100 | #80 | Exceptional $59,806 |
| Ukrainians | 99.4 /100 | #81 | Exceptional $59,728 |
Demographics Similar to Burmese by Median Male Earnings
In terms of median male earnings, the demographic groups most similar to Burmese are Immigrants from Korea ($65,079, a difference of 0.24%), Immigrants from Sweden ($65,406, a difference of 0.26%), Immigrants from Northern Europe ($64,987, a difference of 0.38%), Immigrants from Japan ($65,518, a difference of 0.43%), and Cypriot ($65,549, a difference of 0.48%).
| Demographics | Rating | Rank | Median Male Earnings |
| Immigrants | Eastern Asia | 100.0 /100 | #15 | Exceptional $66,903 |
| Eastern Europeans | 100.0 /100 | #16 | Exceptional $66,472 |
| Immigrants | Belgium | 100.0 /100 | #17 | Exceptional $66,125 |
| Indians (Asian) | 100.0 /100 | #18 | Exceptional $66,078 |
| Cypriots | 100.0 /100 | #19 | Exceptional $65,549 |
| Immigrants | Japan | 100.0 /100 | #20 | Exceptional $65,518 |
| Immigrants | Sweden | 100.0 /100 | #21 | Exceptional $65,406 |
| Burmese | 100.0 /100 | #22 | Exceptional $65,236 |
| Immigrants | Korea | 100.0 /100 | #23 | Exceptional $65,079 |
| Immigrants | Northern Europe | 100.0 /100 | #24 | Exceptional $64,987 |
| Immigrants | Denmark | 100.0 /100 | #25 | Exceptional $64,625 |
| Turks | 100.0 /100 | #26 | Exceptional $64,253 |
| Immigrants | Switzerland | 100.0 /100 | #27 | Exceptional $63,944 |
| Russians | 100.0 /100 | #28 | Exceptional $63,939 |
| Asians | 100.0 /100 | #29 | Exceptional $63,827 |