Immigrants from Indonesia vs Ghanaian Median Male Earnings
COMPARE
Immigrants from Indonesia
Ghanaian
Median Male Earnings
Median Male Earnings Comparison
Immigrants from Indonesia
Ghanaians
$60,935
MEDIAN MALE EARNINGS
99.8/ 100
METRIC RATING
65th/ 347
METRIC RANK
$52,810
MEDIAN MALE EARNINGS
16.1/ 100
METRIC RATING
204th/ 347
METRIC RANK
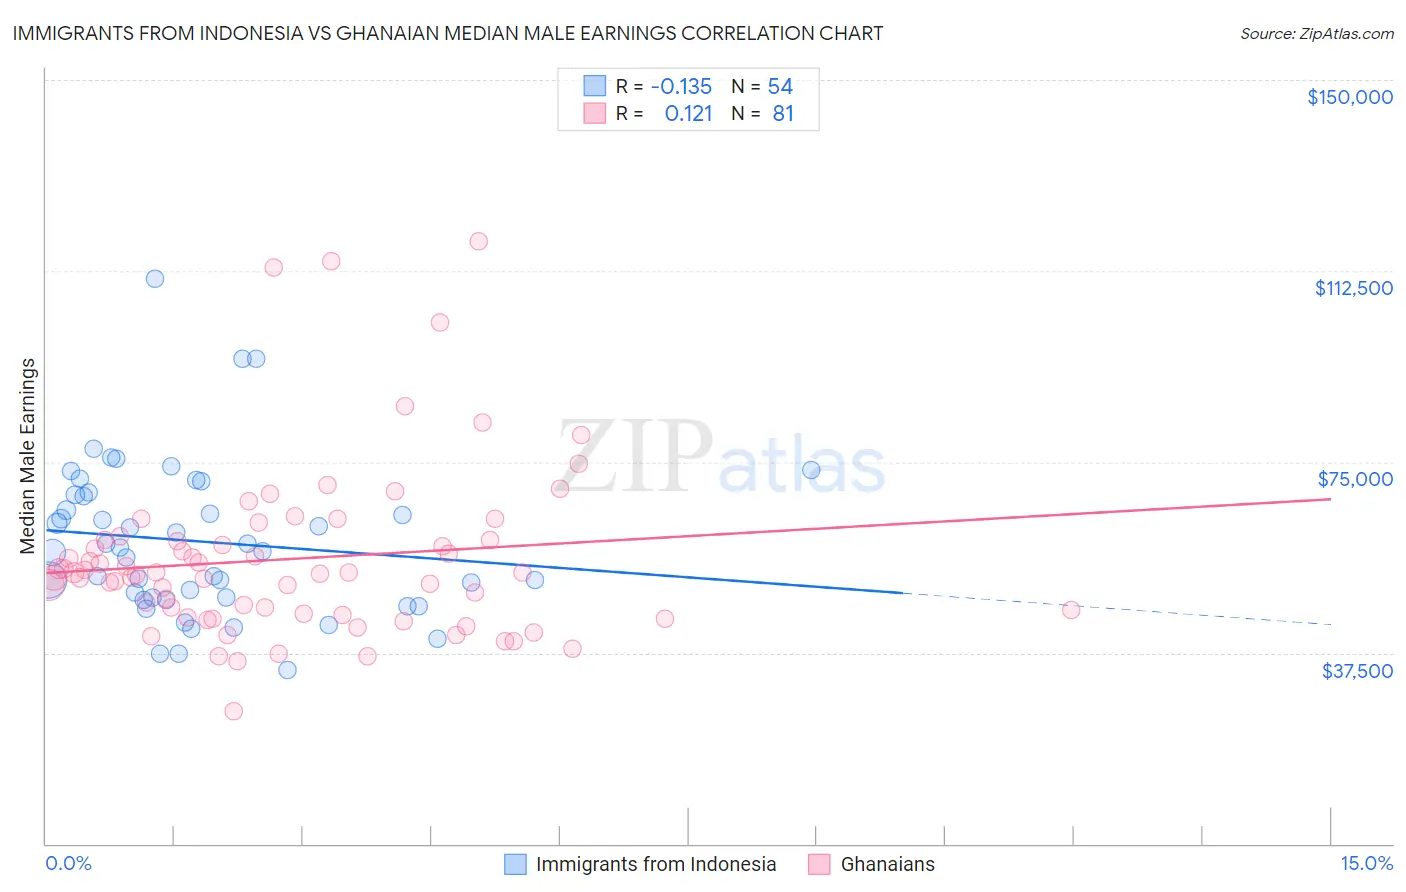
Immigrants from Indonesia vs Ghanaian Median Male Earnings Correlation Chart
The statistical analysis conducted on geographies consisting of 215,756,061 people shows a poor negative correlation between the proportion of Immigrants from Indonesia and median male earnings in the United States with a correlation coefficient (R) of -0.135 and weighted average of $60,935. Similarly, the statistical analysis conducted on geographies consisting of 190,703,925 people shows a poor positive correlation between the proportion of Ghanaians and median male earnings in the United States with a correlation coefficient (R) of 0.121 and weighted average of $52,810, a difference of 15.4%.
Median Male Earnings Correlation Summary
| Measurement | Immigrants from Indonesia | Ghanaian |
| Minimum | $34,072 | $26,089 |
| Maximum | $111,048 | $118,333 |
| Range | $76,976 | $92,244 |
| Mean | $59,341 | $55,935 |
| Median | $57,826 | $53,206 |
| Interquartile 25% (IQ1) | $48,312 | $44,949 |
| Interquartile 75% (IQ3) | $68,539 | $59,627 |
| Interquartile Range (IQR) | $20,227 | $14,678 |
| Standard Deviation (Sample) | $15,206 | $16,875 |
| Standard Deviation (Population) | $15,065 | $16,771 |
Similar Demographics by Median Male Earnings
Demographics Similar to Immigrants from Indonesia by Median Male Earnings
In terms of median male earnings, the demographic groups most similar to Immigrants from Indonesia are Immigrants from Croatia ($60,914, a difference of 0.030%), Immigrants from Eastern Europe ($60,958, a difference of 0.040%), Immigrants from Pakistan ($60,987, a difference of 0.080%), Immigrants from Romania ($61,040, a difference of 0.17%), and Bolivian ($61,066, a difference of 0.21%).
| Demographics | Rating | Rank | Median Male Earnings |
| New Zealanders | 99.9 /100 | #58 | Exceptional $61,199 |
| Immigrants | Netherlands | 99.8 /100 | #59 | Exceptional $61,096 |
| Egyptians | 99.8 /100 | #60 | Exceptional $61,095 |
| Bolivians | 99.8 /100 | #61 | Exceptional $61,066 |
| Immigrants | Romania | 99.8 /100 | #62 | Exceptional $61,040 |
| Immigrants | Pakistan | 99.8 /100 | #63 | Exceptional $60,987 |
| Immigrants | Eastern Europe | 99.8 /100 | #64 | Exceptional $60,958 |
| Immigrants | Indonesia | 99.8 /100 | #65 | Exceptional $60,935 |
| Immigrants | Croatia | 99.8 /100 | #66 | Exceptional $60,914 |
| Immigrants | Spain | 99.8 /100 | #67 | Exceptional $60,750 |
| Immigrants | Serbia | 99.7 /100 | #68 | Exceptional $60,600 |
| Immigrants | Canada | 99.7 /100 | #69 | Exceptional $60,388 |
| Immigrants | Bulgaria | 99.7 /100 | #70 | Exceptional $60,358 |
| Mongolians | 99.7 /100 | #71 | Exceptional $60,350 |
| Immigrants | Western Europe | 99.7 /100 | #72 | Exceptional $60,334 |
Demographics Similar to Ghanaians by Median Male Earnings
In terms of median male earnings, the demographic groups most similar to Ghanaians are Panamanian ($52,835, a difference of 0.050%), Immigrants from Uruguay ($52,860, a difference of 0.10%), Immigrants from Bosnia and Herzegovina ($52,869, a difference of 0.11%), Immigrants from Colombia ($52,725, a difference of 0.16%), and Immigrants from Thailand ($52,908, a difference of 0.19%).
| Demographics | Rating | Rank | Median Male Earnings |
| Immigrants | Kenya | 26.0 /100 | #197 | Fair $53,427 |
| Immigrants | Costa Rica | 22.6 /100 | #198 | Fair $53,237 |
| Tongans | 22.3 /100 | #199 | Fair $53,218 |
| Immigrants | Thailand | 17.5 /100 | #200 | Poor $52,908 |
| Immigrants | Bosnia and Herzegovina | 16.9 /100 | #201 | Poor $52,869 |
| Immigrants | Uruguay | 16.8 /100 | #202 | Poor $52,860 |
| Panamanians | 16.5 /100 | #203 | Poor $52,835 |
| Ghanaians | 16.1 /100 | #204 | Poor $52,810 |
| Immigrants | Colombia | 15.0 /100 | #205 | Poor $52,725 |
| Immigrants | Iraq | 14.5 /100 | #206 | Poor $52,681 |
| Vietnamese | 12.7 /100 | #207 | Poor $52,525 |
| Venezuelans | 12.5 /100 | #208 | Poor $52,510 |
| Bermudans | 12.1 /100 | #209 | Poor $52,465 |
| Delaware | 11.5 /100 | #210 | Poor $52,412 |
| Tlingit-Haida | 11.5 /100 | #211 | Poor $52,409 |