Immigrants from Cameroon vs Slovene Per Capita Income
COMPARE
Immigrants from Cameroon
Slovene
Per Capita Income
Per Capita Income Comparison
Immigrants from Cameroon
Slovenes
$41,334
PER CAPITA INCOME
6.8/ 100
METRIC RATING
223rd/ 347
METRIC RANK
$45,581
PER CAPITA INCOME
89.6/ 100
METRIC RATING
134th/ 347
METRIC RANK
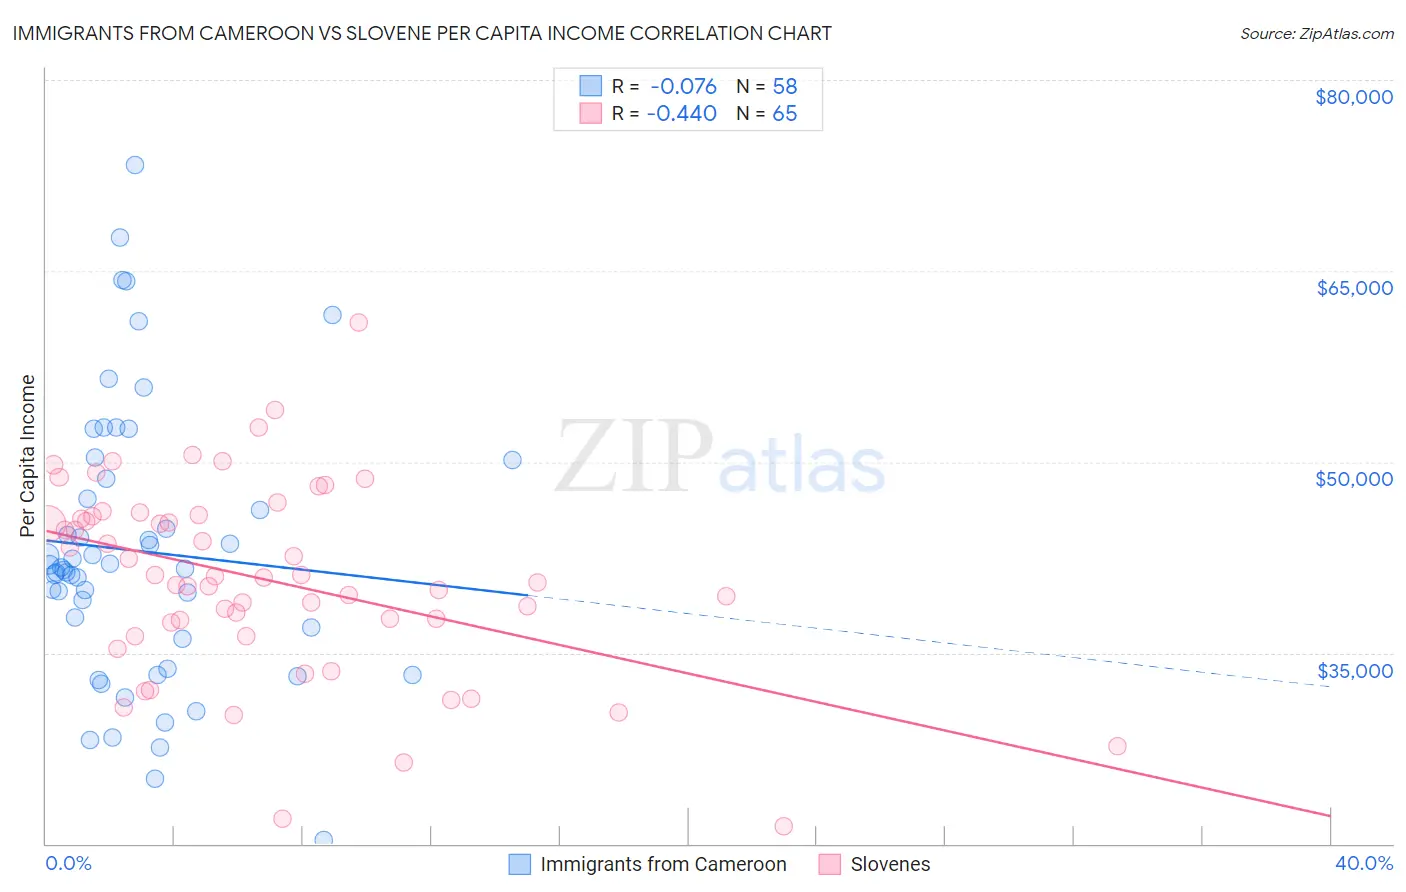
Immigrants from Cameroon vs Slovene Per Capita Income Correlation Chart
The statistical analysis conducted on geographies consisting of 130,769,320 people shows a slight negative correlation between the proportion of Immigrants from Cameroon and per capita income in the United States with a correlation coefficient (R) of -0.076 and weighted average of $41,334. Similarly, the statistical analysis conducted on geographies consisting of 261,356,467 people shows a moderate negative correlation between the proportion of Slovenes and per capita income in the United States with a correlation coefficient (R) of -0.440 and weighted average of $45,581, a difference of 10.3%.
Per Capita Income Correlation Summary
| Measurement | Immigrants from Cameroon | Slovene |
| Minimum | $20,282 | $21,418 |
| Maximum | $73,301 | $60,978 |
| Range | $53,019 | $39,560 |
| Mean | $42,979 | $40,788 |
| Median | $41,647 | $40,958 |
| Interquartile 25% (IQ1) | $36,092 | $36,844 |
| Interquartile 75% (IQ3) | $48,673 | $45,760 |
| Interquartile Range (IQR) | $12,582 | $8,915 |
| Standard Deviation (Sample) | $10,877 | $7,597 |
| Standard Deviation (Population) | $10,783 | $7,538 |
Similar Demographics by Per Capita Income
Demographics Similar to Immigrants from Cameroon by Per Capita Income
In terms of per capita income, the demographic groups most similar to Immigrants from Cameroon are Immigrants from Iraq ($41,365, a difference of 0.070%), Immigrants from St. Vincent and the Grenadines ($41,270, a difference of 0.16%), West Indian ($41,217, a difference of 0.28%), Immigrants from Trinidad and Tobago ($41,476, a difference of 0.34%), and Immigrants from Ecuador ($41,195, a difference of 0.34%).
| Demographics | Rating | Rank | Per Capita Income |
| Tongans | 9.9 /100 | #216 | Tragic $41,693 |
| Guamanians/Chamorros | 9.7 /100 | #217 | Tragic $41,678 |
| Trinidadians and Tobagonians | 9.5 /100 | #218 | Tragic $41,655 |
| Puget Sound Salish | 8.1 /100 | #219 | Tragic $41,495 |
| Immigrants | Barbados | 7.9 /100 | #220 | Tragic $41,478 |
| Immigrants | Trinidad and Tobago | 7.9 /100 | #221 | Tragic $41,476 |
| Immigrants | Iraq | 7.1 /100 | #222 | Tragic $41,365 |
| Immigrants | Cameroon | 6.8 /100 | #223 | Tragic $41,334 |
| Immigrants | St. Vincent and the Grenadines | 6.4 /100 | #224 | Tragic $41,270 |
| West Indians | 6.0 /100 | #225 | Tragic $41,217 |
| Immigrants | Ecuador | 5.9 /100 | #226 | Tragic $41,195 |
| Immigrants | Ghana | 5.5 /100 | #227 | Tragic $41,131 |
| Immigrants | Grenada | 5.5 /100 | #228 | Tragic $41,123 |
| Nigerians | 4.9 /100 | #229 | Tragic $41,026 |
| Native Hawaiians | 4.9 /100 | #230 | Tragic $41,017 |
Demographics Similar to Slovenes by Per Capita Income
In terms of per capita income, the demographic groups most similar to Slovenes are Pakistani ($45,587, a difference of 0.010%), Jordanian ($45,605, a difference of 0.050%), Immigrants from North Macedonia ($45,622, a difference of 0.090%), Luxembourger ($45,663, a difference of 0.18%), and Arab ($45,662, a difference of 0.18%).
| Demographics | Rating | Rank | Per Capita Income |
| Immigrants | Germany | 91.3 /100 | #127 | Exceptional $45,751 |
| Swedes | 91.3 /100 | #128 | Exceptional $45,750 |
| Luxembourgers | 90.4 /100 | #129 | Exceptional $45,663 |
| Arabs | 90.4 /100 | #130 | Exceptional $45,662 |
| Immigrants | North Macedonia | 90.0 /100 | #131 | Exceptional $45,622 |
| Jordanians | 89.9 /100 | #132 | Excellent $45,605 |
| Pakistanis | 89.7 /100 | #133 | Excellent $45,587 |
| Slovenes | 89.6 /100 | #134 | Excellent $45,581 |
| Hungarians | 87.9 /100 | #135 | Excellent $45,426 |
| Immigrants | Oceania | 85.2 /100 | #136 | Excellent $45,220 |
| Immigrants | Syria | 85.2 /100 | #137 | Excellent $45,218 |
| Assyrians/Chaldeans/Syriacs | 84.8 /100 | #138 | Excellent $45,195 |
| Basques | 83.2 /100 | #139 | Excellent $45,086 |
| Immigrants | Jordan | 82.9 /100 | #140 | Excellent $45,066 |
| Slavs | 82.6 /100 | #141 | Excellent $45,049 |