Immigrants from Cabo Verde vs Ute Householder Income Ages 45 - 64 years
COMPARE
Immigrants from Cabo Verde
Ute
Householder Income Ages 45 - 64 years
Householder Income Ages 45 - 64 years Comparison
Immigrants from Cabo Verde
Ute
$83,542
HOUSEHOLDER INCOME AGES 45 - 64 YEARS
0.0/ 100
METRIC RATING
308th/ 347
METRIC RANK
$83,937
HOUSEHOLDER INCOME AGES 45 - 64 YEARS
0.0/ 100
METRIC RATING
306th/ 347
METRIC RANK
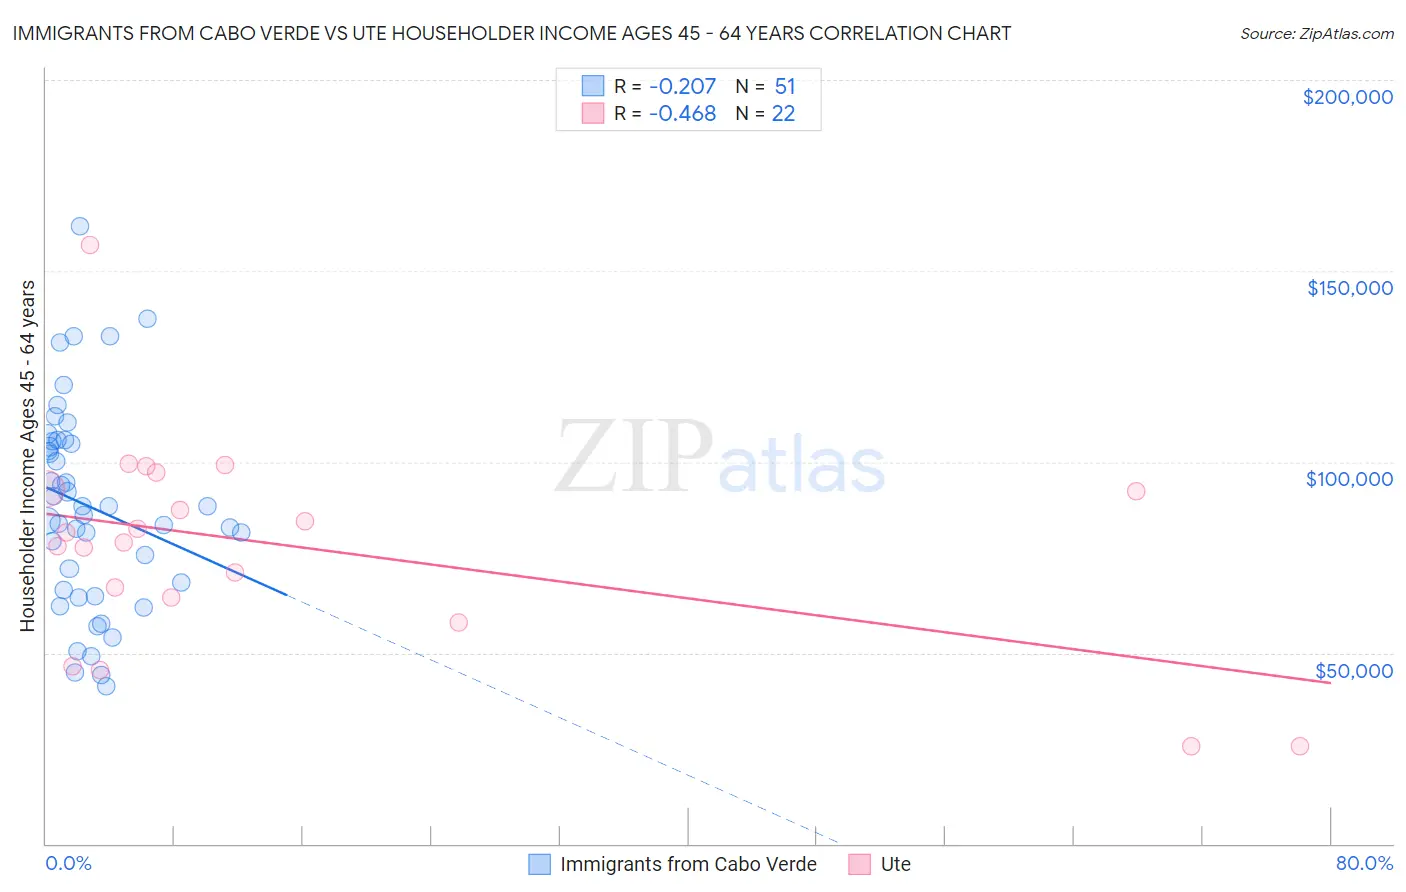
Immigrants from Cabo Verde vs Ute Householder Income Ages 45 - 64 years Correlation Chart
The statistical analysis conducted on geographies consisting of 38,128,015 people shows a weak negative correlation between the proportion of Immigrants from Cabo Verde and household income with householder between the ages 45 and 64 in the United States with a correlation coefficient (R) of -0.207 and weighted average of $83,542. Similarly, the statistical analysis conducted on geographies consisting of 55,640,692 people shows a moderate negative correlation between the proportion of Ute and household income with householder between the ages 45 and 64 in the United States with a correlation coefficient (R) of -0.468 and weighted average of $83,937, a difference of 0.47%.
Householder Income Ages 45 - 64 years Correlation Summary
| Measurement | Immigrants from Cabo Verde | Ute |
| Minimum | $41,310 | $25,694 |
| Maximum | $161,621 | $156,708 |
| Range | $120,311 | $131,014 |
| Mean | $88,314 | $77,764 |
| Median | $88,317 | $80,253 |
| Interquartile 25% (IQ1) | $66,365 | $64,449 |
| Interquartile 75% (IQ3) | $105,555 | $93,045 |
| Interquartile Range (IQR) | $39,191 | $28,595 |
| Standard Deviation (Sample) | $26,486 | $28,260 |
| Standard Deviation (Population) | $26,225 | $27,610 |
Demographics Similar to Immigrants from Cabo Verde and Ute by Householder Income Ages 45 - 64 years
In terms of householder income ages 45 - 64 years, the demographic groups most similar to Immigrants from Cabo Verde are Shoshone ($83,588, a difference of 0.060%), Immigrants from Dominica ($83,311, a difference of 0.28%), Immigrants from Haiti ($83,257, a difference of 0.34%), Immigrants from Bahamas ($83,177, a difference of 0.44%), and Chippewa ($83,943, a difference of 0.48%). Similarly, the demographic groups most similar to Ute are Chippewa ($83,943, a difference of 0.010%), Ottawa ($83,953, a difference of 0.020%), Honduran ($84,079, a difference of 0.17%), Shoshone ($83,588, a difference of 0.42%), and Haitian ($84,384, a difference of 0.53%).
| Demographics | Rating | Rank | Householder Income Ages 45 - 64 years |
| Fijians | 0.1 /100 | #297 | Tragic $85,187 |
| Africans | 0.0 /100 | #298 | Tragic $84,925 |
| Immigrants | Mexico | 0.0 /100 | #299 | Tragic $84,910 |
| Indonesians | 0.0 /100 | #300 | Tragic $84,890 |
| Potawatomi | 0.0 /100 | #301 | Tragic $84,613 |
| Haitians | 0.0 /100 | #302 | Tragic $84,384 |
| Hondurans | 0.0 /100 | #303 | Tragic $84,079 |
| Ottawa | 0.0 /100 | #304 | Tragic $83,953 |
| Chippewa | 0.0 /100 | #305 | Tragic $83,943 |
| Ute | 0.0 /100 | #306 | Tragic $83,937 |
| Shoshone | 0.0 /100 | #307 | Tragic $83,588 |
| Immigrants | Cabo Verde | 0.0 /100 | #308 | Tragic $83,542 |
| Immigrants | Dominica | 0.0 /100 | #309 | Tragic $83,311 |
| Immigrants | Haiti | 0.0 /100 | #310 | Tragic $83,257 |
| Immigrants | Bahamas | 0.0 /100 | #311 | Tragic $83,177 |
| Cajuns | 0.0 /100 | #312 | Tragic $83,015 |
| U.S. Virgin Islanders | 0.0 /100 | #313 | Tragic $82,736 |
| Immigrants | Honduras | 0.0 /100 | #314 | Tragic $82,697 |
| Paiute | 0.0 /100 | #315 | Tragic $82,629 |
| Immigrants | Caribbean | 0.0 /100 | #316 | Tragic $82,513 |
| Colville | 0.0 /100 | #317 | Tragic $82,474 |