Immigrants from Cabo Verde vs Choctaw Householder Income Ages 45 - 64 years
COMPARE
Immigrants from Cabo Verde
Choctaw
Householder Income Ages 45 - 64 years
Householder Income Ages 45 - 64 years Comparison
Immigrants from Cabo Verde
Choctaw
$83,542
HOUSEHOLDER INCOME AGES 45 - 64 YEARS
0.0/ 100
METRIC RATING
308th/ 347
METRIC RANK
$82,287
HOUSEHOLDER INCOME AGES 45 - 64 YEARS
0.0/ 100
METRIC RATING
318th/ 347
METRIC RANK
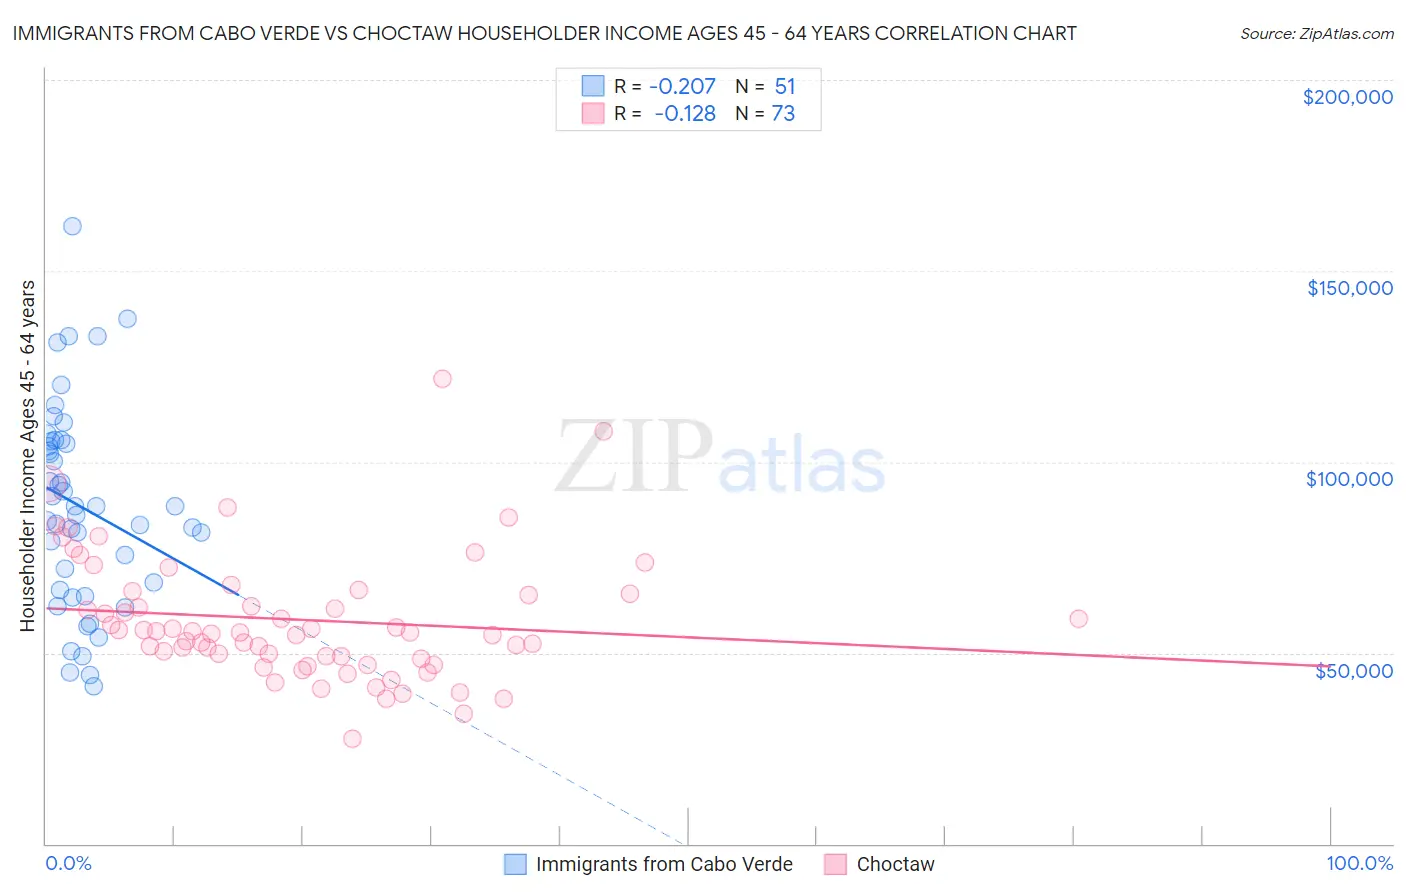
Immigrants from Cabo Verde vs Choctaw Householder Income Ages 45 - 64 years Correlation Chart
The statistical analysis conducted on geographies consisting of 38,128,015 people shows a weak negative correlation between the proportion of Immigrants from Cabo Verde and household income with householder between the ages 45 and 64 in the United States with a correlation coefficient (R) of -0.207 and weighted average of $83,542. Similarly, the statistical analysis conducted on geographies consisting of 269,212,167 people shows a poor negative correlation between the proportion of Choctaw and household income with householder between the ages 45 and 64 in the United States with a correlation coefficient (R) of -0.128 and weighted average of $82,287, a difference of 1.5%.
Householder Income Ages 45 - 64 years Correlation Summary
| Measurement | Immigrants from Cabo Verde | Choctaw |
| Minimum | $41,310 | $27,500 |
| Maximum | $161,621 | $121,667 |
| Range | $120,311 | $94,167 |
| Mean | $88,314 | $58,687 |
| Median | $88,317 | $55,469 |
| Interquartile 25% (IQ1) | $66,365 | $48,732 |
| Interquartile 75% (IQ3) | $105,555 | $65,840 |
| Interquartile Range (IQR) | $39,191 | $17,109 |
| Standard Deviation (Sample) | $26,486 | $16,580 |
| Standard Deviation (Population) | $26,225 | $16,466 |
Demographics Similar to Immigrants from Cabo Verde and Choctaw by Householder Income Ages 45 - 64 years
In terms of householder income ages 45 - 64 years, the demographic groups most similar to Immigrants from Cabo Verde are Shoshone ($83,588, a difference of 0.060%), Immigrants from Dominica ($83,311, a difference of 0.28%), Immigrants from Haiti ($83,257, a difference of 0.34%), Immigrants from Bahamas ($83,177, a difference of 0.44%), and Ute ($83,937, a difference of 0.47%). Similarly, the demographic groups most similar to Choctaw are Chickasaw ($82,193, a difference of 0.11%), Apache ($82,184, a difference of 0.13%), Yuman ($82,139, a difference of 0.18%), Colville ($82,474, a difference of 0.23%), and Immigrants from Caribbean ($82,513, a difference of 0.28%).
| Demographics | Rating | Rank | Householder Income Ages 45 - 64 years |
| Hondurans | 0.0 /100 | #303 | Tragic $84,079 |
| Ottawa | 0.0 /100 | #304 | Tragic $83,953 |
| Chippewa | 0.0 /100 | #305 | Tragic $83,943 |
| Ute | 0.0 /100 | #306 | Tragic $83,937 |
| Shoshone | 0.0 /100 | #307 | Tragic $83,588 |
| Immigrants | Cabo Verde | 0.0 /100 | #308 | Tragic $83,542 |
| Immigrants | Dominica | 0.0 /100 | #309 | Tragic $83,311 |
| Immigrants | Haiti | 0.0 /100 | #310 | Tragic $83,257 |
| Immigrants | Bahamas | 0.0 /100 | #311 | Tragic $83,177 |
| Cajuns | 0.0 /100 | #312 | Tragic $83,015 |
| U.S. Virgin Islanders | 0.0 /100 | #313 | Tragic $82,736 |
| Immigrants | Honduras | 0.0 /100 | #314 | Tragic $82,697 |
| Paiute | 0.0 /100 | #315 | Tragic $82,629 |
| Immigrants | Caribbean | 0.0 /100 | #316 | Tragic $82,513 |
| Colville | 0.0 /100 | #317 | Tragic $82,474 |
| Choctaw | 0.0 /100 | #318 | Tragic $82,287 |
| Chickasaw | 0.0 /100 | #319 | Tragic $82,193 |
| Apache | 0.0 /100 | #320 | Tragic $82,184 |
| Yuman | 0.0 /100 | #321 | Tragic $82,139 |
| Sioux | 0.0 /100 | #322 | Tragic $81,750 |
| Bahamians | 0.0 /100 | #323 | Tragic $81,369 |