Houma vs Immigrants from Dominican Republic Householder Income Under 25 years
COMPARE
Houma
Immigrants from Dominican Republic
Householder Income Under 25 years
Householder Income Under 25 years Comparison
Houma
Immigrants from Dominican Republic
$44,356
HOUSEHOLDER INCOME UNDER 25 YEARS
0.0/ 100
METRIC RATING
341st/ 347
METRIC RANK
$50,204
HOUSEHOLDER INCOME UNDER 25 YEARS
0.8/ 100
METRIC RATING
263rd/ 347
METRIC RANK
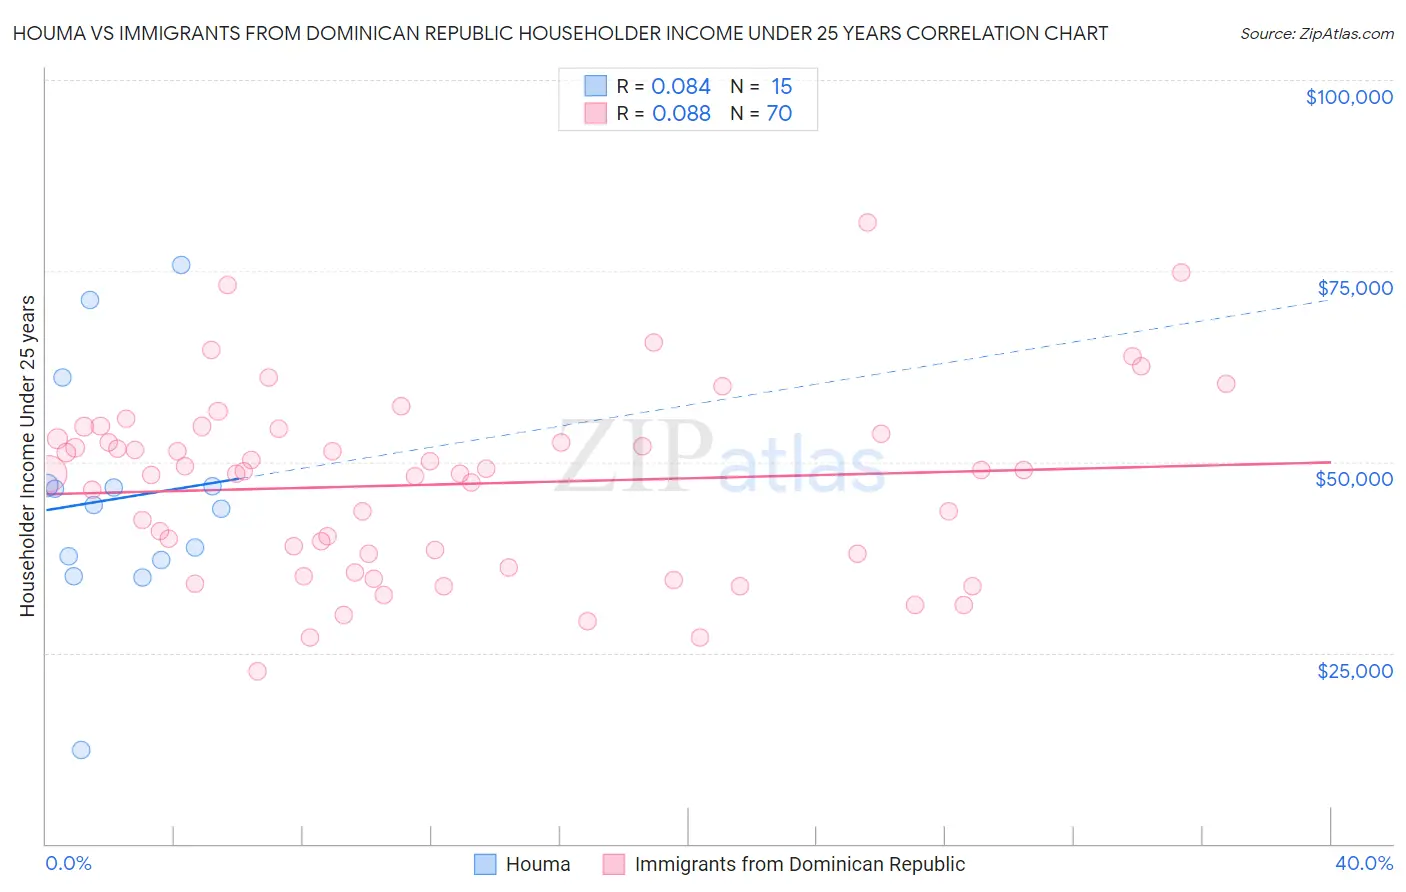
Houma vs Immigrants from Dominican Republic Householder Income Under 25 years Correlation Chart
The statistical analysis conducted on geographies consisting of 35,697,476 people shows a slight positive correlation between the proportion of Houma and household income with householder under the age of 25 in the United States with a correlation coefficient (R) of 0.084 and weighted average of $44,356. Similarly, the statistical analysis conducted on geographies consisting of 234,366,360 people shows a slight positive correlation between the proportion of Immigrants from Dominican Republic and household income with householder under the age of 25 in the United States with a correlation coefficient (R) of 0.088 and weighted average of $50,204, a difference of 13.2%.
Householder Income Under 25 years Correlation Summary
| Measurement | Houma | Immigrants from Dominican Republic |
| Minimum | $12,212 | $22,546 |
| Maximum | $75,747 | $81,320 |
| Range | $63,535 | $58,774 |
| Mean | $45,249 | $47,058 |
| Median | $44,434 | $48,612 |
| Interquartile 25% (IQ1) | $37,081 | $37,938 |
| Interquartile 75% (IQ3) | $46,891 | $53,715 |
| Interquartile Range (IQR) | $9,810 | $15,777 |
| Standard Deviation (Sample) | $15,434 | $11,939 |
| Standard Deviation (Population) | $14,910 | $11,853 |
Similar Demographics by Householder Income Under 25 years
Demographics Similar to Houma by Householder Income Under 25 years
In terms of householder income under 25 years, the demographic groups most similar to Houma are Black/African American ($44,381, a difference of 0.060%), Arapaho ($44,003, a difference of 0.80%), Kiowa ($44,733, a difference of 0.85%), Chickasaw ($44,763, a difference of 0.92%), and Pueblo ($45,018, a difference of 1.5%).
| Demographics | Rating | Rank | Householder Income Under 25 years |
| Creek | 0.0 /100 | #333 | Tragic $45,371 |
| Cajuns | 0.0 /100 | #334 | Tragic $45,338 |
| Cheyenne | 0.0 /100 | #335 | Tragic $45,275 |
| Tohono O'odham | 0.0 /100 | #336 | Tragic $45,248 |
| Pueblo | 0.0 /100 | #337 | Tragic $45,018 |
| Chickasaw | 0.0 /100 | #338 | Tragic $44,763 |
| Kiowa | 0.0 /100 | #339 | Tragic $44,733 |
| Blacks/African Americans | 0.0 /100 | #340 | Tragic $44,381 |
| Houma | 0.0 /100 | #341 | Tragic $44,356 |
| Arapaho | 0.0 /100 | #342 | Tragic $44,003 |
| Immigrants | Yemen | 0.0 /100 | #343 | Tragic $43,591 |
| Immigrants | Congo | 0.0 /100 | #344 | Tragic $43,266 |
| Navajo | 0.0 /100 | #345 | Tragic $42,380 |
| Puerto Ricans | 0.0 /100 | #346 | Tragic $39,726 |
| Lumbee | 0.0 /100 | #347 | Tragic $34,584 |
Demographics Similar to Immigrants from Dominican Republic by Householder Income Under 25 years
In terms of householder income under 25 years, the demographic groups most similar to Immigrants from Dominican Republic are Haitian ($50,231, a difference of 0.050%), Hungarian ($50,247, a difference of 0.090%), Fijian ($50,132, a difference of 0.14%), Hispanic or Latino ($50,279, a difference of 0.15%), and Belgian ($50,113, a difference of 0.18%).
| Demographics | Rating | Rank | Householder Income Under 25 years |
| Immigrants | Cuba | 1.2 /100 | #256 | Tragic $50,374 |
| Lebanese | 1.1 /100 | #257 | Tragic $50,355 |
| Whites/Caucasians | 1.1 /100 | #258 | Tragic $50,336 |
| Immigrants | Dominica | 1.0 /100 | #259 | Tragic $50,301 |
| Hispanics or Latinos | 0.9 /100 | #260 | Tragic $50,279 |
| Hungarians | 0.9 /100 | #261 | Tragic $50,247 |
| Haitians | 0.8 /100 | #262 | Tragic $50,231 |
| Immigrants | Dominican Republic | 0.8 /100 | #263 | Tragic $50,204 |
| Fijians | 0.6 /100 | #264 | Tragic $50,132 |
| Belgians | 0.6 /100 | #265 | Tragic $50,113 |
| Immigrants | Venezuela | 0.6 /100 | #266 | Tragic $50,109 |
| Immigrants | Laos | 0.5 /100 | #267 | Tragic $50,041 |
| Venezuelans | 0.5 /100 | #268 | Tragic $50,011 |
| Ute | 0.5 /100 | #269 | Tragic $49,997 |
| Mexicans | 0.5 /100 | #270 | Tragic $49,989 |