Cape Verdean vs Panamanian Householder Income Under 25 years
COMPARE
Cape Verdean
Panamanian
Householder Income Under 25 years
Householder Income Under 25 years Comparison
Cape Verdeans
Panamanians
$51,387
HOUSEHOLDER INCOME UNDER 25 YEARS
12.3/ 100
METRIC RATING
205th/ 347
METRIC RANK
$51,611
HOUSEHOLDER INCOME UNDER 25 YEARS
19.5/ 100
METRIC RATING
191st/ 347
METRIC RANK
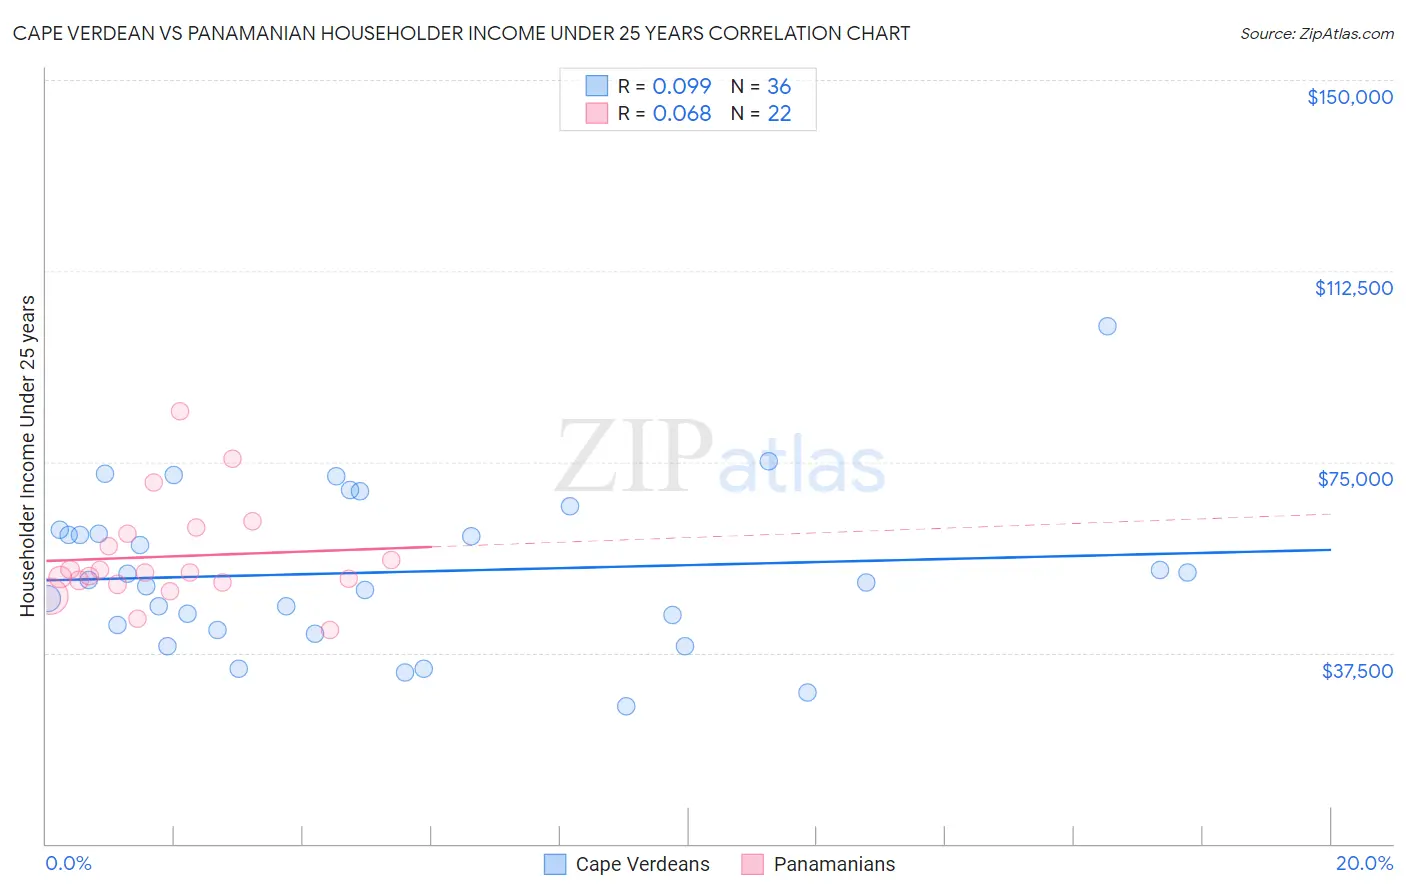
Cape Verdean vs Panamanian Householder Income Under 25 years Correlation Chart
The statistical analysis conducted on geographies consisting of 98,258,749 people shows a slight positive correlation between the proportion of Cape Verdeans and household income with householder under the age of 25 in the United States with a correlation coefficient (R) of 0.099 and weighted average of $51,387. Similarly, the statistical analysis conducted on geographies consisting of 249,167,453 people shows a slight positive correlation between the proportion of Panamanians and household income with householder under the age of 25 in the United States with a correlation coefficient (R) of 0.068 and weighted average of $51,611, a difference of 0.44%.
Householder Income Under 25 years Correlation Summary
| Measurement | Cape Verdean | Panamanian |
| Minimum | $26,996 | $41,875 |
| Maximum | $101,579 | $84,853 |
| Range | $74,583 | $42,978 |
| Mean | $53,331 | $56,431 |
| Median | $51,533 | $53,276 |
| Interquartile 25% (IQ1) | $42,557 | $51,350 |
| Interquartile 75% (IQ3) | $61,225 | $60,790 |
| Interquartile Range (IQR) | $18,668 | $9,440 |
| Standard Deviation (Sample) | $15,423 | $10,018 |
| Standard Deviation (Population) | $15,208 | $9,787 |
Demographics Similar to Cape Verdeans and Panamanians by Householder Income Under 25 years
In terms of householder income under 25 years, the demographic groups most similar to Cape Verdeans are Immigrants from Latin America ($51,387, a difference of 0.0%), South African ($51,383, a difference of 0.010%), Immigrants from Jordan ($51,370, a difference of 0.030%), Czech ($51,421, a difference of 0.070%), and Immigrants from Cameroon ($51,433, a difference of 0.090%). Similarly, the demographic groups most similar to Panamanians are Malaysian ($51,615, a difference of 0.010%), West Indian ($51,583, a difference of 0.060%), Immigrants from Eritrea ($51,574, a difference of 0.070%), Croatian ($51,662, a difference of 0.10%), and Northern European ($51,678, a difference of 0.13%).
| Demographics | Rating | Rank | Householder Income Under 25 years |
| Northern Europeans | 22.2 /100 | #188 | Fair $51,678 |
| Croatians | 21.6 /100 | #189 | Fair $51,662 |
| Malaysians | 19.7 /100 | #190 | Poor $51,615 |
| Panamanians | 19.5 /100 | #191 | Poor $51,611 |
| West Indians | 18.5 /100 | #192 | Poor $51,583 |
| Immigrants | Eritrea | 18.1 /100 | #193 | Poor $51,574 |
| Guatemalans | 16.4 /100 | #194 | Poor $51,525 |
| Estonians | 16.4 /100 | #195 | Poor $51,523 |
| Palestinians | 16.1 /100 | #196 | Poor $51,515 |
| Pima | 15.7 /100 | #197 | Poor $51,503 |
| Immigrants | Syria | 15.4 /100 | #198 | Poor $51,494 |
| Swiss | 15.4 /100 | #199 | Poor $51,493 |
| Immigrants | West Indies | 14.9 /100 | #200 | Poor $51,479 |
| British | 14.9 /100 | #201 | Poor $51,477 |
| Immigrants | Guatemala | 14.0 /100 | #202 | Poor $51,447 |
| Immigrants | Cameroon | 13.6 /100 | #203 | Poor $51,433 |
| Czechs | 13.2 /100 | #204 | Poor $51,421 |
| Cape Verdeans | 12.3 /100 | #205 | Poor $51,387 |
| Immigrants | Latin America | 12.3 /100 | #206 | Poor $51,387 |
| South Africans | 12.2 /100 | #207 | Poor $51,383 |
| Immigrants | Jordan | 11.9 /100 | #208 | Poor $51,370 |