Guyanese vs Panamanian Median Male Earnings
COMPARE
Guyanese
Panamanian
Median Male Earnings
Median Male Earnings Comparison
Guyanese
Panamanians
$50,613
MEDIAN MALE EARNINGS
2.2/ 100
METRIC RATING
242nd/ 347
METRIC RANK
$52,835
MEDIAN MALE EARNINGS
16.5/ 100
METRIC RATING
203rd/ 347
METRIC RANK
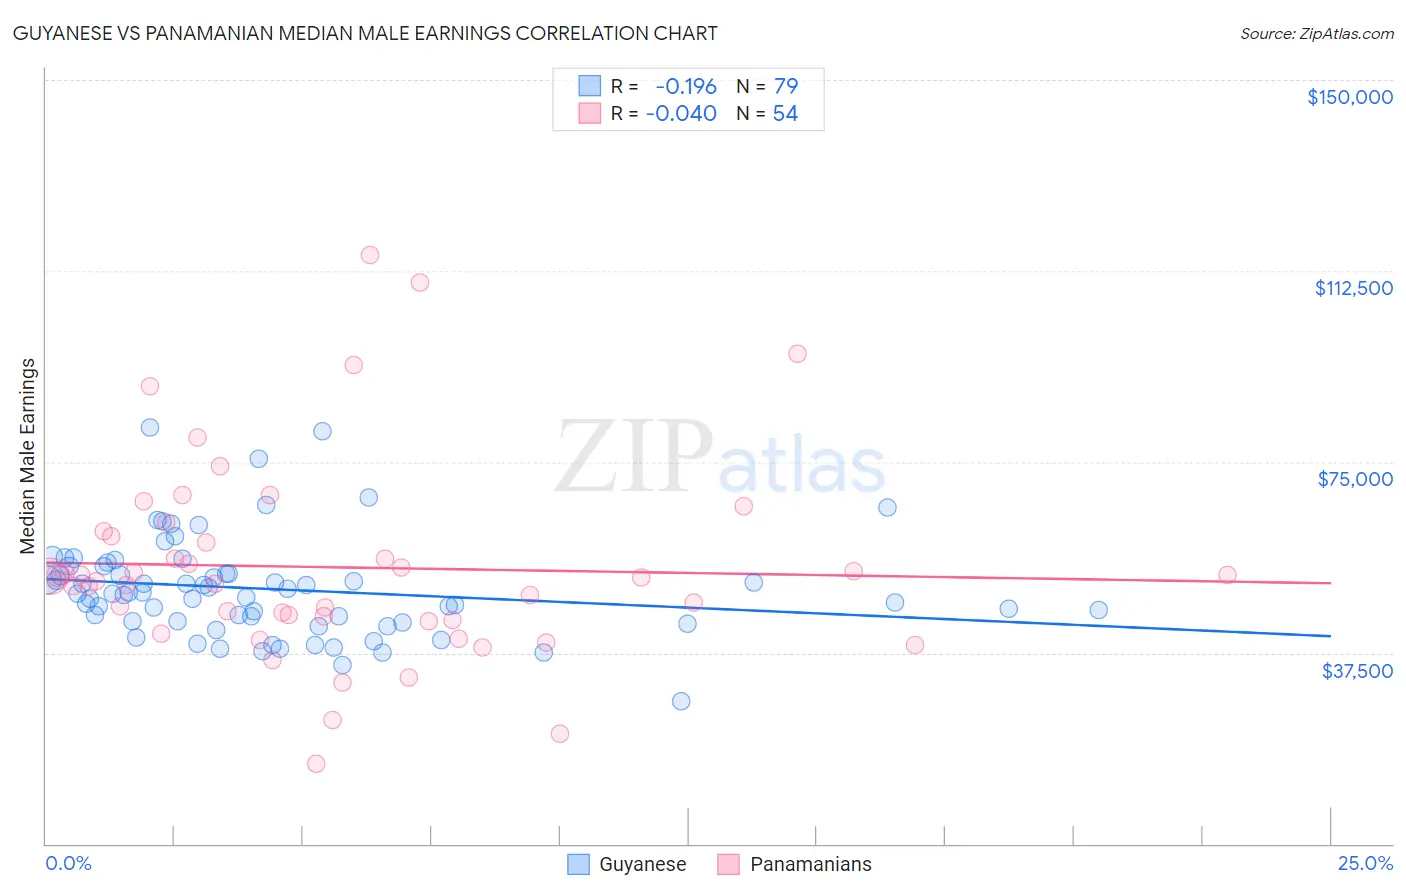
Guyanese vs Panamanian Median Male Earnings Correlation Chart
The statistical analysis conducted on geographies consisting of 176,926,771 people shows a poor negative correlation between the proportion of Guyanese and median male earnings in the United States with a correlation coefficient (R) of -0.196 and weighted average of $50,613. Similarly, the statistical analysis conducted on geographies consisting of 281,209,556 people shows no correlation between the proportion of Panamanians and median male earnings in the United States with a correlation coefficient (R) of -0.040 and weighted average of $52,835, a difference of 4.4%.
Median Male Earnings Correlation Summary
| Measurement | Guyanese | Panamanian |
| Minimum | $28,099 | $15,735 |
| Maximum | $81,815 | $115,625 |
| Range | $53,716 | $99,890 |
| Mean | $50,024 | $54,298 |
| Median | $49,104 | $51,973 |
| Interquartile 25% (IQ1) | $43,659 | $43,917 |
| Interquartile 75% (IQ3) | $54,533 | $60,350 |
| Interquartile Range (IQR) | $10,874 | $16,433 |
| Standard Deviation (Sample) | $9,787 | $19,573 |
| Standard Deviation (Population) | $9,725 | $19,391 |
Similar Demographics by Median Male Earnings
Demographics Similar to Guyanese by Median Male Earnings
In terms of median male earnings, the demographic groups most similar to Guyanese are French American Indian ($50,611, a difference of 0.0%), Immigrants from St. Vincent and the Grenadines ($50,665, a difference of 0.10%), Houma ($50,547, a difference of 0.13%), West Indian ($50,682, a difference of 0.14%), and Hawaiian ($50,488, a difference of 0.25%).
| Demographics | Rating | Rank | Median Male Earnings |
| Immigrants | Western Africa | 3.0 /100 | #235 | Tragic $50,940 |
| Pennsylvania Germans | 2.8 /100 | #236 | Tragic $50,878 |
| Immigrants | Barbados | 2.6 /100 | #237 | Tragic $50,795 |
| Malaysians | 2.5 /100 | #238 | Tragic $50,772 |
| Americans | 2.5 /100 | #239 | Tragic $50,761 |
| West Indians | 2.3 /100 | #240 | Tragic $50,682 |
| Immigrants | St. Vincent and the Grenadines | 2.3 /100 | #241 | Tragic $50,665 |
| Guyanese | 2.2 /100 | #242 | Tragic $50,613 |
| French American Indians | 2.2 /100 | #243 | Tragic $50,611 |
| Houma | 2.0 /100 | #244 | Tragic $50,547 |
| Hawaiians | 1.9 /100 | #245 | Tragic $50,488 |
| Immigrants | Ecuador | 1.9 /100 | #246 | Tragic $50,474 |
| Sub-Saharan Africans | 1.8 /100 | #247 | Tragic $50,408 |
| Immigrants | Guyana | 1.6 /100 | #248 | Tragic $50,321 |
| Immigrants | Burma/Myanmar | 1.6 /100 | #249 | Tragic $50,298 |
Demographics Similar to Panamanians by Median Male Earnings
In terms of median male earnings, the demographic groups most similar to Panamanians are Immigrants from Uruguay ($52,860, a difference of 0.050%), Ghanaian ($52,810, a difference of 0.050%), Immigrants from Bosnia and Herzegovina ($52,869, a difference of 0.060%), Immigrants from Thailand ($52,908, a difference of 0.14%), and Immigrants from Colombia ($52,725, a difference of 0.21%).
| Demographics | Rating | Rank | Median Male Earnings |
| Immigrants | Africa | 26.6 /100 | #196 | Fair $53,457 |
| Immigrants | Kenya | 26.0 /100 | #197 | Fair $53,427 |
| Immigrants | Costa Rica | 22.6 /100 | #198 | Fair $53,237 |
| Tongans | 22.3 /100 | #199 | Fair $53,218 |
| Immigrants | Thailand | 17.5 /100 | #200 | Poor $52,908 |
| Immigrants | Bosnia and Herzegovina | 16.9 /100 | #201 | Poor $52,869 |
| Immigrants | Uruguay | 16.8 /100 | #202 | Poor $52,860 |
| Panamanians | 16.5 /100 | #203 | Poor $52,835 |
| Ghanaians | 16.1 /100 | #204 | Poor $52,810 |
| Immigrants | Colombia | 15.0 /100 | #205 | Poor $52,725 |
| Immigrants | Iraq | 14.5 /100 | #206 | Poor $52,681 |
| Vietnamese | 12.7 /100 | #207 | Poor $52,525 |
| Venezuelans | 12.5 /100 | #208 | Poor $52,510 |
| Bermudans | 12.1 /100 | #209 | Poor $52,465 |
| Delaware | 11.5 /100 | #210 | Poor $52,412 |