Guatemalan vs Immigrants from Southern Europe Householder Income Ages 45 - 64 years
COMPARE
Guatemalan
Immigrants from Southern Europe
Householder Income Ages 45 - 64 years
Householder Income Ages 45 - 64 years Comparison
Guatemalans
Immigrants from Southern Europe
$87,705
HOUSEHOLDER INCOME AGES 45 - 64 YEARS
0.2/ 100
METRIC RATING
271st/ 347
METRIC RANK
$107,775
HOUSEHOLDER INCOME AGES 45 - 64 YEARS
97.7/ 100
METRIC RATING
98th/ 347
METRIC RANK
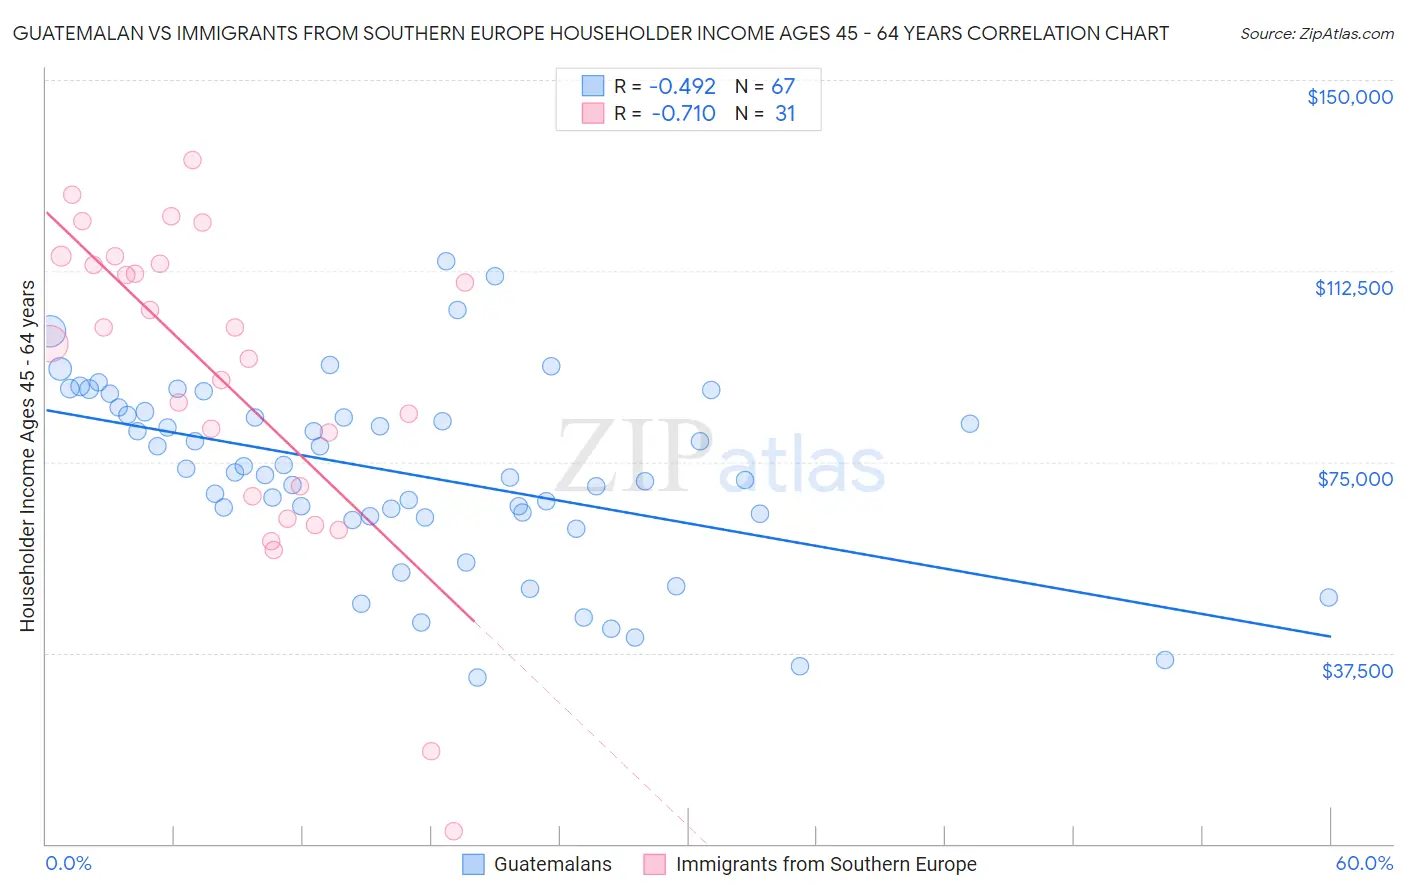
Guatemalan vs Immigrants from Southern Europe Householder Income Ages 45 - 64 years Correlation Chart
The statistical analysis conducted on geographies consisting of 408,736,377 people shows a moderate negative correlation between the proportion of Guatemalans and household income with householder between the ages 45 and 64 in the United States with a correlation coefficient (R) of -0.492 and weighted average of $87,705. Similarly, the statistical analysis conducted on geographies consisting of 402,204,768 people shows a strong negative correlation between the proportion of Immigrants from Southern Europe and household income with householder between the ages 45 and 64 in the United States with a correlation coefficient (R) of -0.710 and weighted average of $107,775, a difference of 22.9%.
Householder Income Ages 45 - 64 years Correlation Summary
| Measurement | Guatemalan | Immigrants from Southern Europe |
| Minimum | $32,665 | $2,499 |
| Maximum | $114,444 | $134,237 |
| Range | $81,779 | $131,738 |
| Mean | $72,782 | $90,713 |
| Median | $72,945 | $98,268 |
| Interquartile 25% (IQ1) | $64,395 | $68,345 |
| Interquartile 75% (IQ3) | $84,870 | $113,880 |
| Interquartile Range (IQR) | $20,474 | $45,535 |
| Standard Deviation (Sample) | $18,098 | $31,080 |
| Standard Deviation (Population) | $17,962 | $30,575 |
Similar Demographics by Householder Income Ages 45 - 64 years
Demographics Similar to Guatemalans by Householder Income Ages 45 - 64 years
In terms of householder income ages 45 - 64 years, the demographic groups most similar to Guatemalans are Immigrants from Liberia ($87,739, a difference of 0.040%), Cape Verdean ($87,580, a difference of 0.14%), Spanish American ($87,836, a difference of 0.15%), Spanish American Indian ($87,561, a difference of 0.16%), and Immigrants from Micronesia ($87,864, a difference of 0.18%).
| Demographics | Rating | Rank | Householder Income Ages 45 - 64 years |
| Osage | 0.3 /100 | #264 | Tragic $88,390 |
| Jamaicans | 0.2 /100 | #265 | Tragic $88,327 |
| Immigrants | West Indies | 0.2 /100 | #266 | Tragic $88,164 |
| Hmong | 0.2 /100 | #267 | Tragic $88,115 |
| Immigrants | Micronesia | 0.2 /100 | #268 | Tragic $87,864 |
| Spanish Americans | 0.2 /100 | #269 | Tragic $87,836 |
| Immigrants | Liberia | 0.2 /100 | #270 | Tragic $87,739 |
| Guatemalans | 0.2 /100 | #271 | Tragic $87,705 |
| Cape Verdeans | 0.2 /100 | #272 | Tragic $87,580 |
| Spanish American Indians | 0.2 /100 | #273 | Tragic $87,561 |
| Iroquois | 0.1 /100 | #274 | Tragic $87,255 |
| Immigrants | Belize | 0.1 /100 | #275 | Tragic $87,229 |
| Immigrants | Latin America | 0.1 /100 | #276 | Tragic $87,219 |
| Cree | 0.1 /100 | #277 | Tragic $87,185 |
| Immigrants | Jamaica | 0.1 /100 | #278 | Tragic $87,035 |
Demographics Similar to Immigrants from Southern Europe by Householder Income Ages 45 - 64 years
In terms of householder income ages 45 - 64 years, the demographic groups most similar to Immigrants from Southern Europe are Palestinian ($107,721, a difference of 0.050%), Northern European ($107,870, a difference of 0.090%), Immigrants from Serbia ($107,569, a difference of 0.19%), Immigrants from Kazakhstan ($107,378, a difference of 0.37%), and Immigrants from Moldova ($107,357, a difference of 0.39%).
| Demographics | Rating | Rank | Householder Income Ages 45 - 64 years |
| Immigrants | Lebanon | 98.3 /100 | #91 | Exceptional $108,471 |
| Croatians | 98.3 /100 | #92 | Exceptional $108,383 |
| Immigrants | Croatia | 98.2 /100 | #93 | Exceptional $108,304 |
| Sri Lankans | 98.2 /100 | #94 | Exceptional $108,270 |
| Immigrants | Hungary | 98.2 /100 | #95 | Exceptional $108,267 |
| Immigrants | Argentina | 98.2 /100 | #96 | Exceptional $108,264 |
| Northern Europeans | 97.8 /100 | #97 | Exceptional $107,870 |
| Immigrants | Southern Europe | 97.7 /100 | #98 | Exceptional $107,775 |
| Palestinians | 97.6 /100 | #99 | Exceptional $107,721 |
| Immigrants | Serbia | 97.4 /100 | #100 | Exceptional $107,569 |
| Immigrants | Kazakhstan | 97.2 /100 | #101 | Exceptional $107,378 |
| Immigrants | Moldova | 97.1 /100 | #102 | Exceptional $107,357 |
| Syrians | 96.9 /100 | #103 | Exceptional $107,207 |
| Immigrants | Ukraine | 96.7 /100 | #104 | Exceptional $107,079 |
| Macedonians | 96.7 /100 | #105 | Exceptional $107,074 |