Guamanian/Chamorro vs Immigrants from Zimbabwe Householder Income Ages 25 - 44 years
COMPARE
Guamanian/Chamorro
Immigrants from Zimbabwe
Householder Income Ages 25 - 44 years
Householder Income Ages 25 - 44 years Comparison
Guamanians/Chamorros
Immigrants from Zimbabwe
$93,569
HOUSEHOLDER INCOME AGES 25 - 44 YEARS
36.5/ 100
METRIC RATING
183rd/ 347
METRIC RANK
$97,880
HOUSEHOLDER INCOME AGES 25 - 44 YEARS
86.3/ 100
METRIC RATING
132nd/ 347
METRIC RANK
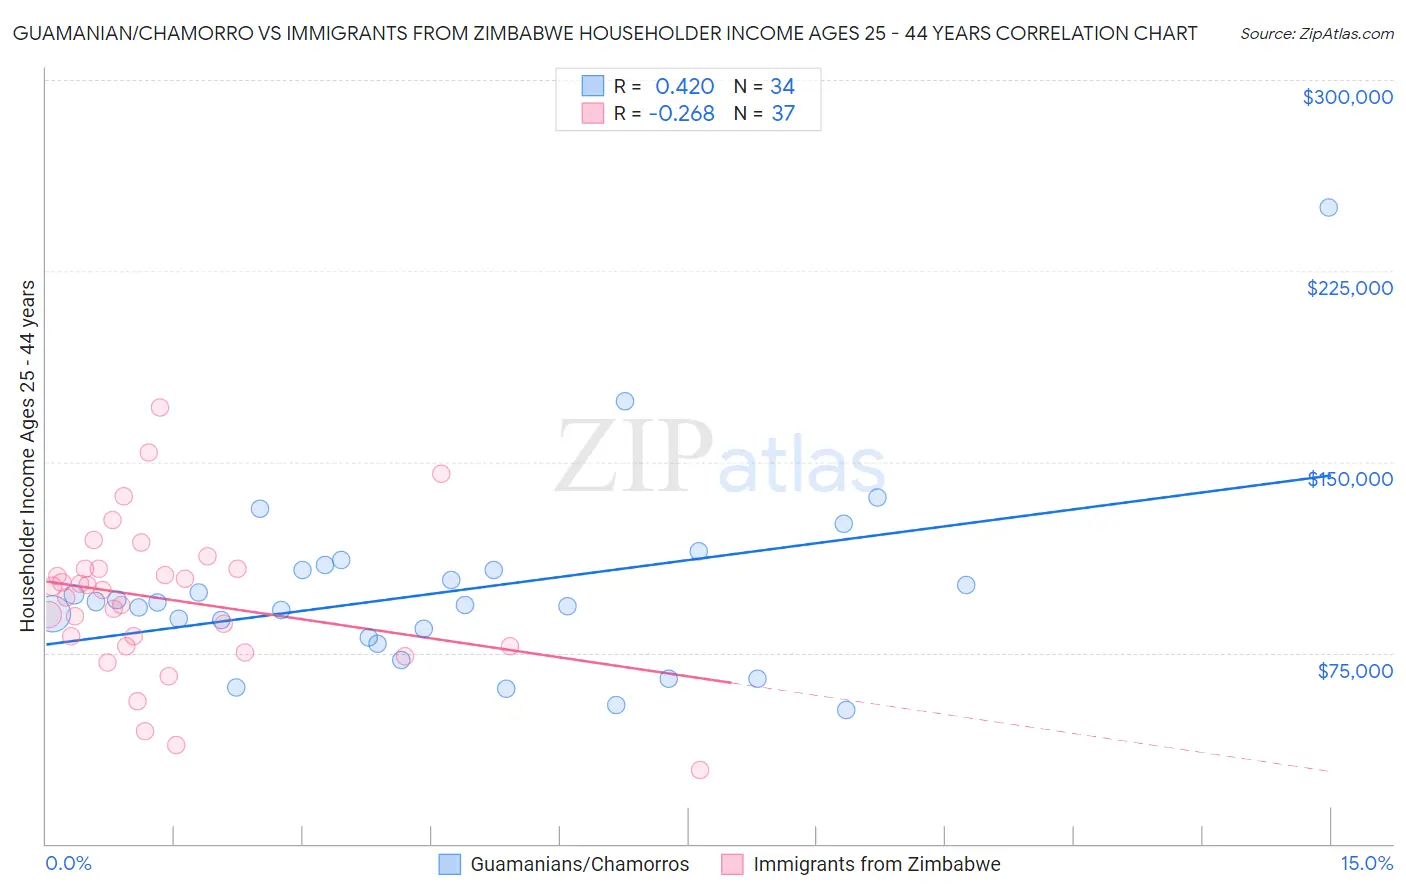
Guamanian/Chamorro vs Immigrants from Zimbabwe Householder Income Ages 25 - 44 years Correlation Chart
The statistical analysis conducted on geographies consisting of 221,693,514 people shows a moderate positive correlation between the proportion of Guamanians/Chamorros and household income with householder between the ages 25 and 44 in the United States with a correlation coefficient (R) of 0.420 and weighted average of $93,569. Similarly, the statistical analysis conducted on geographies consisting of 117,746,283 people shows a weak negative correlation between the proportion of Immigrants from Zimbabwe and household income with householder between the ages 25 and 44 in the United States with a correlation coefficient (R) of -0.268 and weighted average of $97,880, a difference of 4.6%.
Householder Income Ages 25 - 44 years Correlation Summary
| Measurement | Guamanian/Chamorro | Immigrants from Zimbabwe |
| Minimum | $52,500 | $28,895 |
| Maximum | $250,001 | $171,540 |
| Range | $197,501 | $142,645 |
| Mean | $99,073 | $95,961 |
| Median | $94,237 | $99,716 |
| Interquartile 25% (IQ1) | $81,009 | $77,685 |
| Interquartile 75% (IQ3) | $107,396 | $107,912 |
| Interquartile Range (IQR) | $26,387 | $30,227 |
| Standard Deviation (Sample) | $36,403 | $29,842 |
| Standard Deviation (Population) | $35,864 | $29,436 |
Similar Demographics by Householder Income Ages 25 - 44 years
Demographics Similar to Guamanians/Chamorros by Householder Income Ages 25 - 44 years
In terms of householder income ages 25 - 44 years, the demographic groups most similar to Guamanians/Chamorros are German ($93,531, a difference of 0.040%), Uruguayan ($93,631, a difference of 0.070%), French ($93,665, a difference of 0.10%), Puget Sound Salish ($93,661, a difference of 0.10%), and Immigrants from Eritrea ($93,466, a difference of 0.11%).
| Demographics | Rating | Rank | Householder Income Ages 25 - 44 years |
| Immigrants | Immigrants | 48.0 /100 | #176 | Average $94,423 |
| Belgians | 45.8 /100 | #177 | Average $94,262 |
| Immigrants | South America | 42.8 /100 | #178 | Average $94,042 |
| French Canadians | 38.2 /100 | #179 | Fair $93,694 |
| French | 37.8 /100 | #180 | Fair $93,665 |
| Puget Sound Salish | 37.7 /100 | #181 | Fair $93,661 |
| Uruguayans | 37.3 /100 | #182 | Fair $93,631 |
| Guamanians/Chamorros | 36.5 /100 | #183 | Fair $93,569 |
| Germans | 36.0 /100 | #184 | Fair $93,531 |
| Immigrants | Eritrea | 35.2 /100 | #185 | Fair $93,466 |
| Sierra Leoneans | 34.8 /100 | #186 | Fair $93,435 |
| Spaniards | 34.0 /100 | #187 | Fair $93,366 |
| Immigrants | Sierra Leone | 30.9 /100 | #188 | Fair $93,115 |
| Dutch | 30.5 /100 | #189 | Fair $93,081 |
| Welsh | 30.0 /100 | #190 | Fair $93,039 |
Demographics Similar to Immigrants from Zimbabwe by Householder Income Ages 25 - 44 years
In terms of householder income ages 25 - 44 years, the demographic groups most similar to Immigrants from Zimbabwe are Immigrants from Albania ($97,929, a difference of 0.050%), Tsimshian ($97,809, a difference of 0.070%), Immigrants from Kuwait ($98,122, a difference of 0.25%), Canadian ($97,625, a difference of 0.26%), and Immigrants from Oceania ($97,623, a difference of 0.26%).
| Demographics | Rating | Rank | Householder Income Ages 25 - 44 years |
| Pakistanis | 89.3 /100 | #125 | Excellent $98,401 |
| British | 89.1 /100 | #126 | Excellent $98,359 |
| Serbians | 88.9 /100 | #127 | Excellent $98,320 |
| Europeans | 88.9 /100 | #128 | Excellent $98,310 |
| Brazilians | 88.6 /100 | #129 | Excellent $98,267 |
| Immigrants | Kuwait | 87.8 /100 | #130 | Excellent $98,122 |
| Immigrants | Albania | 86.6 /100 | #131 | Excellent $97,929 |
| Immigrants | Zimbabwe | 86.3 /100 | #132 | Excellent $97,880 |
| Tsimshian | 85.8 /100 | #133 | Excellent $97,809 |
| Canadians | 84.5 /100 | #134 | Excellent $97,625 |
| Immigrants | Oceania | 84.5 /100 | #135 | Excellent $97,623 |
| Hungarians | 83.9 /100 | #136 | Excellent $97,544 |
| Lebanese | 82.3 /100 | #137 | Excellent $97,339 |
| Arabs | 82.3 /100 | #138 | Excellent $97,336 |
| Immigrants | Peru | 82.2 /100 | #139 | Excellent $97,329 |