Pennsylvania German vs Immigrants from North Macedonia Householder Income Ages 25 - 44 years
COMPARE
Pennsylvania German
Immigrants from North Macedonia
Householder Income Ages 25 - 44 years
Householder Income Ages 25 - 44 years Comparison
Pennsylvania Germans
Immigrants from North Macedonia
$85,836
HOUSEHOLDER INCOME AGES 25 - 44 YEARS
0.8/ 100
METRIC RATING
250th/ 347
METRIC RANK
$100,101
HOUSEHOLDER INCOME AGES 25 - 44 YEARS
95.6/ 100
METRIC RATING
109th/ 347
METRIC RANK
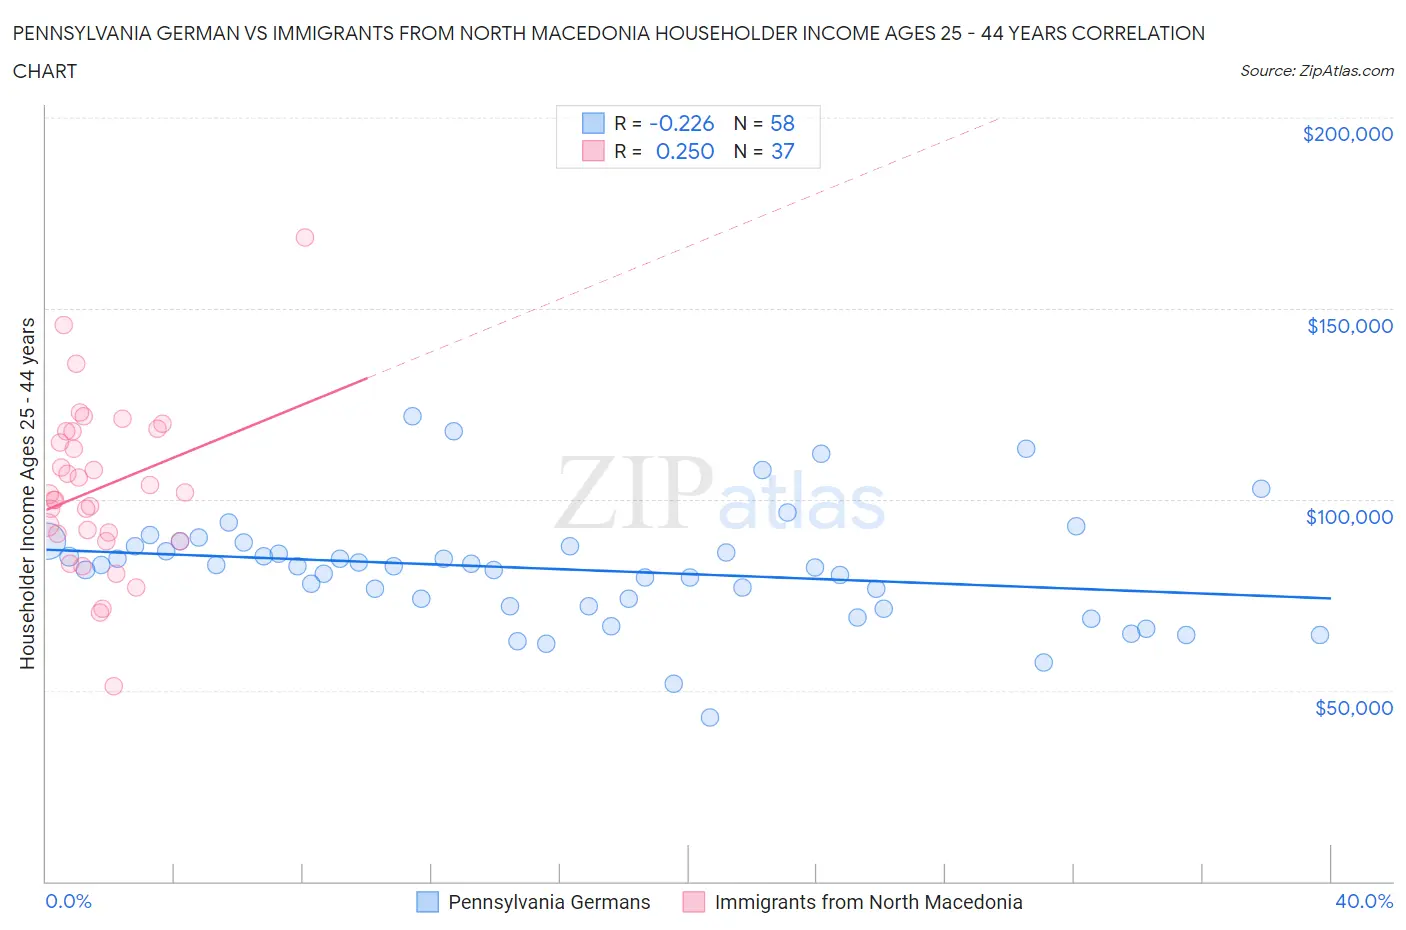
Pennsylvania German vs Immigrants from North Macedonia Householder Income Ages 25 - 44 years Correlation Chart
The statistical analysis conducted on geographies consisting of 233,340,356 people shows a weak negative correlation between the proportion of Pennsylvania Germans and household income with householder between the ages 25 and 44 in the United States with a correlation coefficient (R) of -0.226 and weighted average of $85,836. Similarly, the statistical analysis conducted on geographies consisting of 74,266,818 people shows a weak positive correlation between the proportion of Immigrants from North Macedonia and household income with householder between the ages 25 and 44 in the United States with a correlation coefficient (R) of 0.250 and weighted average of $100,101, a difference of 16.6%.
Householder Income Ages 25 - 44 years Correlation Summary
| Measurement | Pennsylvania German | Immigrants from North Macedonia |
| Minimum | $42,875 | $51,151 |
| Maximum | $121,909 | $168,534 |
| Range | $79,034 | $117,383 |
| Mean | $81,694 | $102,890 |
| Median | $82,382 | $101,325 |
| Interquartile 25% (IQ1) | $72,120 | $89,993 |
| Interquartile 75% (IQ3) | $87,825 | $117,844 |
| Interquartile Range (IQR) | $15,704 | $27,851 |
| Standard Deviation (Sample) | $15,048 | $21,872 |
| Standard Deviation (Population) | $14,918 | $21,575 |
Similar Demographics by Householder Income Ages 25 - 44 years
Demographics Similar to Pennsylvania Germans by Householder Income Ages 25 - 44 years
In terms of householder income ages 25 - 44 years, the demographic groups most similar to Pennsylvania Germans are French American Indian ($85,899, a difference of 0.070%), Cape Verdean ($85,758, a difference of 0.090%), Immigrants from Western Africa ($85,676, a difference of 0.19%), Immigrants from Sudan ($86,109, a difference of 0.32%), and British West Indian ($85,565, a difference of 0.32%).
| Demographics | Rating | Rank | Householder Income Ages 25 - 44 years |
| Immigrants | West Indies | 1.5 /100 | #243 | Tragic $87,063 |
| Immigrants | Venezuela | 1.5 /100 | #244 | Tragic $87,038 |
| Immigrants | El Salvador | 1.4 /100 | #245 | Tragic $86,913 |
| Immigrants | Burma/Myanmar | 1.3 /100 | #246 | Tragic $86,736 |
| Immigrants | Nigeria | 1.2 /100 | #247 | Tragic $86,589 |
| Immigrants | Sudan | 0.9 /100 | #248 | Tragic $86,109 |
| French American Indians | 0.8 /100 | #249 | Tragic $85,899 |
| Pennsylvania Germans | 0.8 /100 | #250 | Tragic $85,836 |
| Cape Verdeans | 0.8 /100 | #251 | Tragic $85,758 |
| Immigrants | Western Africa | 0.7 /100 | #252 | Tragic $85,676 |
| British West Indians | 0.7 /100 | #253 | Tragic $85,565 |
| Immigrants | Laos | 0.7 /100 | #254 | Tragic $85,553 |
| German Russians | 0.6 /100 | #255 | Tragic $85,220 |
| Central Americans | 0.5 /100 | #256 | Tragic $85,144 |
| Mexican American Indians | 0.5 /100 | #257 | Tragic $85,066 |
Demographics Similar to Immigrants from North Macedonia by Householder Income Ages 25 - 44 years
In terms of householder income ages 25 - 44 years, the demographic groups most similar to Immigrants from North Macedonia are Immigrants from Afghanistan ($99,977, a difference of 0.12%), Immigrants from South Eastern Asia ($100,283, a difference of 0.18%), Chilean ($99,900, a difference of 0.20%), Northern European ($100,457, a difference of 0.36%), and Polish ($99,685, a difference of 0.42%).
| Demographics | Rating | Rank | Householder Income Ages 25 - 44 years |
| Immigrants | Lebanon | 97.4 /100 | #102 | Exceptional $101,124 |
| Immigrants | Moldova | 97.4 /100 | #103 | Exceptional $101,091 |
| Immigrants | Poland | 97.4 /100 | #104 | Exceptional $101,065 |
| Immigrants | Vietnam | 96.5 /100 | #105 | Exceptional $100,535 |
| Immigrants | Brazil | 96.5 /100 | #106 | Exceptional $100,534 |
| Northern Europeans | 96.3 /100 | #107 | Exceptional $100,457 |
| Immigrants | South Eastern Asia | 96.0 /100 | #108 | Exceptional $100,283 |
| Immigrants | North Macedonia | 95.6 /100 | #109 | Exceptional $100,101 |
| Immigrants | Afghanistan | 95.3 /100 | #110 | Exceptional $99,977 |
| Chileans | 95.1 /100 | #111 | Exceptional $99,900 |
| Poles | 94.5 /100 | #112 | Exceptional $99,685 |
| Tongans | 94.2 /100 | #113 | Exceptional $99,604 |
| Immigrants | Western Asia | 94.0 /100 | #114 | Exceptional $99,516 |
| Carpatho Rusyns | 93.7 /100 | #115 | Exceptional $99,449 |
| Portuguese | 93.7 /100 | #116 | Exceptional $99,429 |