Fijian vs Ethiopian Householder Income Ages 45 - 64 years

COMPARE

Fijian
Race
Ancestry
AfghanAfricanAlaska NativeAlaskan AthabascanAlbanianAleutAlsatianAmericanApacheArabArapahoArgentineanArmenianAssyrian/Chaldean/SyriacAustralianAustrianBahamianBangladeshiBarbadianBasqueBelgianBelizeanBermudanBhutaneseBlackfeetBolivianBrazilianBritishBritish West IndianBulgarianBurmeseCajunCambodianCanadianCape VerdeanCarpatho RusynCelticCentral AmericanCentral American IndianCherokeeCheyenneChickasawChileanChineseChippewaChoctawColombianColvilleComancheCosta RicanCreeCreekCroatianCrowCubanCypriotCzechCzechoslovakianDanishDelawareDominicanDutchDutch West IndianEastern EuropeanEcuadorianEgyptianEnglishEstonianEuropeanFijianFilipinoFinnishFrenchFrench American IndianFrench CanadianGermanGerman RussianGhanaianGreekGuamanian/ChamorroGuatemalanGuyaneseHaitianHmongHonduranHopiHoumaHungarianIcelanderIndian (Asian)IndonesianInupiatIranianIraqiIrishIroquoisIsraeliItalianJamaicanJapaneseJordanianKenyanKiowaKoreanLaotianLatvianLebaneseLiberianLithuanianLumbeeLuxembourgerMacedonianMalaysianMalteseMarshalleseMenomineeMexicanMexican American IndianMongolianMoroccanNative HawaiianNavajoNepaleseNew ZealanderNicaraguanNigerianNorthern EuropeanNorwegianOkinawanOsageOttawaPaiutePakistaniPalestinianPanamanianParaguayanPennsylvania GermanPeruvianPimaPolishPortuguesePotawatomiPuebloPuerto RicanPuget Sound SalishRomanianRussianSalvadoranSamoanScandinavianScotch-IrishScottishSeminoleSenegaleseSerbianShoshoneSierra LeoneanSiouxSlavicSlovakSloveneSomaliSouth AfricanSouth AmericanSouth American IndianSoviet UnionSpaniardSpanishSpanish AmericanSpanish American IndianSri LankanSubsaharan AfricanSudaneseSwedishSwissSyrianTaiwaneseThaiTlingit-HaidaTohono O'OdhamTonganTrinidadian and TobagonianTsimshianTurkishU.S. Virgin IslanderUgandanUkrainianUruguayanUteVenezuelanVietnameseWelshWest IndianYakamaYaquiYugoslavianYumanYup'ikZimbabwean
Immigration
NonimmigrantsImmigrantsAfghanistanAfricaAlbaniaArgentinaArmeniaAsiaAustraliaAustriaBahamasBangladeshBarbadosBelarusBelgiumBelizeBoliviaBosnia and HerzegovinaBrazilBulgariaBurma/MyanmarCabo VerdeCambodiaCameroonCanadaCaribbeanCentral AmericaChileChinaColombiaCongoCosta RicaCroatiaCubaCzechoslovakiaDenmarkDominicaDominican RepublicEastern AfricaEastern AsiaEastern EuropeEcuadorEgyptEl SalvadorEnglandEritreaEthiopiaEuropeFijiFranceGermanyGhanaGreeceGrenadaGuatemalaGuyanaHaitiHondurasHong KongHungaryIndiaIndonesiaIranIraqIrelandIsraelItalyJamaicaJapanJordanKazakhstanKenyaKoreaKuwaitLaosLatin AmericaLatviaLebanonLiberiaLithuaniaMalaysiaMexicoMicronesiaMiddle AfricaMoldovaMoroccoNepalNetherlandsNicaraguaNigeriaNorth AmericaNorth MacedoniaNorthern AfricaNorthern EuropeNorwayOceaniaPakistanPanamaPeruPhilippinesPolandPortugalRomaniaRussiaSaudi ArabiaScotlandSenegalSerbiaSierra LeoneSingaporeSomaliaSouth AfricaSouth AmericaSouth Central AsiaSouth Eastern AsiaSouthern EuropeSpainSri LankaSt. Vincent and the GrenadinesSudanSwedenSwitzerlandSyriaTaiwanThailandTrinidad and TobagoTurkeyUgandaUkraineUruguayUzbekistanVenezuelaVietnamWest IndiesWestern AfricaWestern AsiaWestern EuropeYemenZaireZimbabweAzores
Ethiopian
Race
Ancestry
AfghanAfricanAlaska NativeAlaskan AthabascanAlbanianAleutAlsatianAmericanApacheArabArapahoArgentineanArmenianAssyrian/Chaldean/SyriacAustralianAustrianBahamianBangladeshiBarbadianBasqueBelgianBelizeanBermudanBhutaneseBlackfeetBolivianBrazilianBritishBritish West IndianBulgarianBurmeseCajunCambodianCanadianCape VerdeanCarpatho RusynCelticCentral AmericanCentral American IndianCherokeeCheyenneChickasawChileanChineseChippewaChoctawColombianColvilleComancheCosta RicanCreeCreekCroatianCrowCubanCypriotCzechCzechoslovakianDanishDelawareDominicanDutchDutch West IndianEastern EuropeanEcuadorianEgyptianEnglishEstonianEthiopianEuropeanFilipinoFinnishFrenchFrench American IndianFrench CanadianGermanGerman RussianGhanaianGreekGuamanian/ChamorroGuatemalanGuyaneseHaitianHmongHonduranHopiHoumaHungarianIcelanderIndian (Asian)IndonesianInupiatIranianIraqiIrishIroquoisIsraeliItalianJamaicanJapaneseJordanianKenyanKiowaKoreanLaotianLatvianLebaneseLiberianLithuanianLumbeeLuxembourgerMacedonianMalaysianMalteseMarshalleseMenomineeMexicanMexican American IndianMongolianMoroccanNative HawaiianNavajoNepaleseNew ZealanderNicaraguanNigerianNorthern EuropeanNorwegianOkinawanOsageOttawaPaiutePakistaniPalestinianPanamanianParaguayanPennsylvania GermanPeruvianPimaPolishPortuguesePotawatomiPuebloPuerto RicanPuget Sound SalishRomanianRussianSalvadoranSamoanScandinavianScotch-IrishScottishSeminoleSenegaleseSerbianShoshoneSierra LeoneanSiouxSlavicSlovakSloveneSomaliSouth AfricanSouth AmericanSouth American IndianSoviet UnionSpaniardSpanishSpanish AmericanSpanish American IndianSri LankanSubsaharan AfricanSudaneseSwedishSwissSyrianTaiwaneseThaiTlingit-HaidaTohono O'OdhamTonganTrinidadian and TobagonianTsimshianTurkishU.S. Virgin IslanderUgandanUkrainianUruguayanUteVenezuelanVietnameseWelshWest IndianYakamaYaquiYugoslavianYumanYup'ikZimbabwean
Immigration
NonimmigrantsImmigrantsAfghanistanAfricaAlbaniaArgentinaArmeniaAsiaAustraliaAustriaBahamasBangladeshBarbadosBelarusBelgiumBelizeBoliviaBosnia and HerzegovinaBrazilBulgariaBurma/MyanmarCabo VerdeCambodiaCameroonCanadaCaribbeanCentral AmericaChileChinaColombiaCongoCosta RicaCroatiaCubaCzechoslovakiaDenmarkDominicaDominican RepublicEastern AfricaEastern AsiaEastern EuropeEcuadorEgyptEl SalvadorEnglandEritreaEthiopiaEuropeFijiFranceGermanyGhanaGreeceGrenadaGuatemalaGuyanaHaitiHondurasHong KongHungaryIndiaIndonesiaIranIraqIrelandIsraelItalyJamaicaJapanJordanKazakhstanKenyaKoreaKuwaitLaosLatin AmericaLatviaLebanonLiberiaLithuaniaMalaysiaMexicoMicronesiaMiddle AfricaMoldovaMoroccoNepalNetherlandsNicaraguaNigeriaNorth AmericaNorth MacedoniaNorthern AfricaNorthern EuropeNorwayOceaniaPakistanPanamaPeruPhilippinesPolandPortugalRomaniaRussiaSaudi ArabiaScotlandSenegalSerbiaSierra LeoneSingaporeSomaliaSouth AfricaSouth AmericaSouth Central AsiaSouth Eastern AsiaSouthern EuropeSpainSri LankaSt. Vincent and the GrenadinesSudanSwedenSwitzerlandSyriaTaiwanThailandTrinidad and TobagoTurkeyUgandaUkraineUruguayUzbekistanVenezuelaVietnamWest IndiesWestern AfricaWestern AsiaWestern EuropeYemenZaireZimbabweAzores
Householder Income Ages 45 - 64 years
Income
Poverty
Unemployment
Labor Participation
Family Structure
Vehicle Availability
Education Level
Disability

Householder Income Ages 45 - 64 years Comparison

Fijians

Ethiopians

Tragic
Excellent
$85,187
HOUSEHOLDER INCOME AGES 45 - 64 YEARS
0.1/ 100
METRIC RATING
297th/ 347
METRIC RANK
$103,736
HOUSEHOLDER INCOME AGES 45 - 64 YEARS
84.7/ 100
METRIC RATING
138th/ 347
METRIC RANK

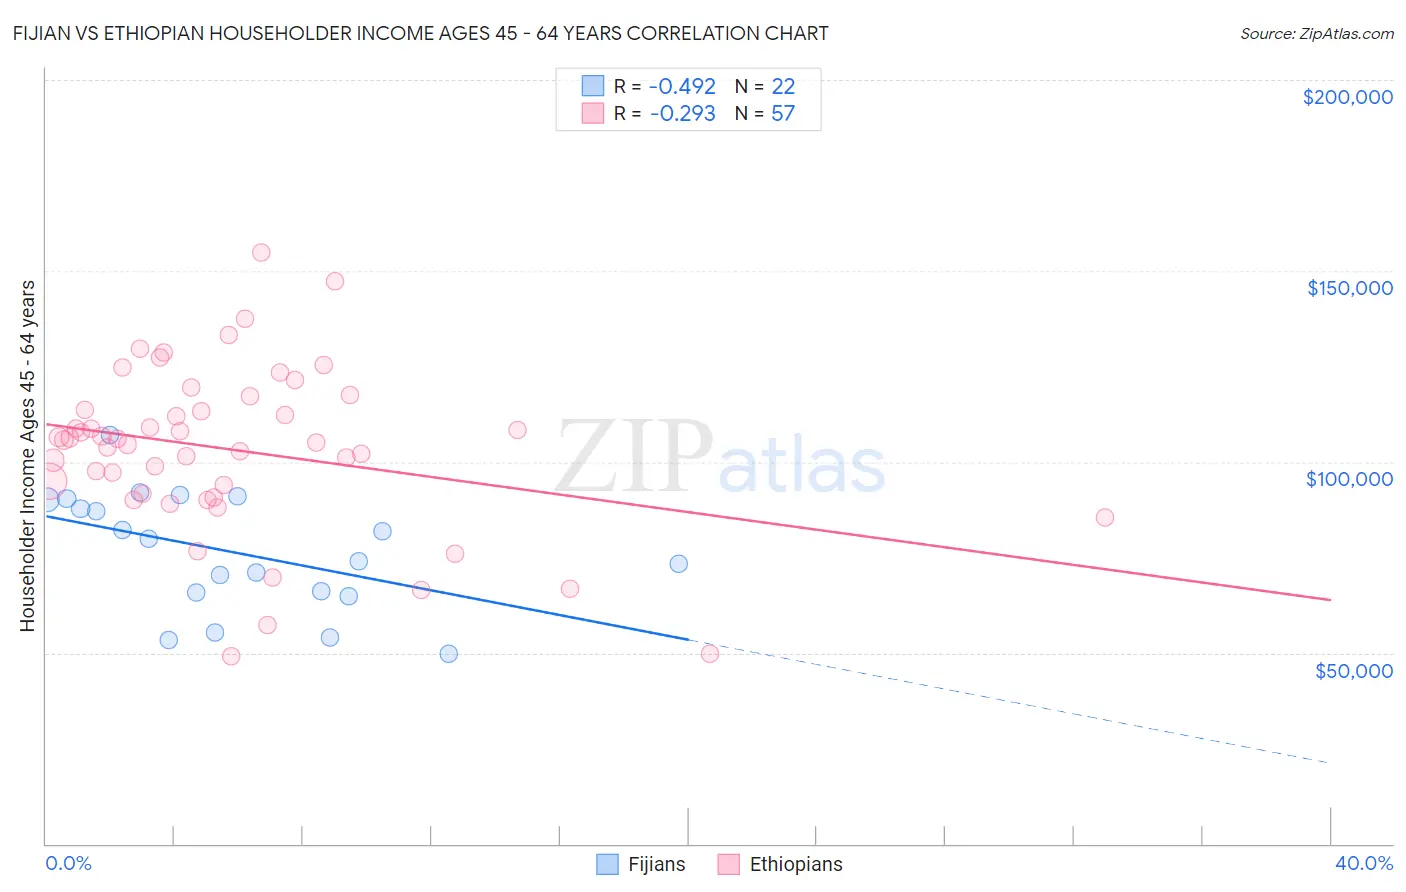
Fijian vs Ethiopian Householder Income Ages 45 - 64 years Correlation Chart

The statistical analysis conducted on geographies consisting of 55,936,100 people shows a moderate negative correlation between the proportion of Fijians and household income with householder between the ages 45 and 64 in the United States with a correlation coefficient (R) of -0.492 and weighted average of $85,187. Similarly, the statistical analysis conducted on geographies consisting of 222,913,789 people shows a weak negative correlation between the proportion of Ethiopians and household income with householder between the ages 45 and 64 in the United States with a correlation coefficient (R) of -0.293 and weighted average of $103,736, a difference of 21.8%.
Fijian vs Ethiopian Householder Income Ages 45 - 64 years

Householder Income Ages 45 - 64 years Correlation Summary

MeasurementFijianEthiopian
Minimum$49,688$48,981
Maximum$107,109$154,904
Range$57,421$105,923
Mean$76,278$103,166
Median$76,951$105,724
Interquartile 25% (IQ1)$65,957$91,126
Interquartile 75% (IQ3)$90,029$115,330
Interquartile Range (IQR)$24,072$24,204
Standard Deviation (Sample)$15,327$21,688
Standard Deviation (Population)$14,974$21,497

Similar Demographics by Householder Income Ages 45 - 64 years

Demographics Similar to Fijians by Householder Income Ages 45 - 64 years

In terms of householder income ages 45 - 64 years, the demographic groups most similar to Fijians are Immigrants from Zaire ($85,207, a difference of 0.020%), African ($84,925, a difference of 0.31%), Immigrants from Mexico ($84,910, a difference of 0.33%), Indonesian ($84,890, a difference of 0.35%), and Immigrants from Grenada ($85,552, a difference of 0.43%).
DemographicsRating | RankHouseholder Income Ages 45 - 64 years
Cherokee
0.1
/100
|
#290
Tragic
$86,125
Hispanics or Latinos
0.1
/100
|
#291
Tragic
$86,006
Immigrants | Central America
0.1
/100
|
#292
Tragic
$85,965
Comanche
0.1
/100
|
#293
Tragic
$85,787
British West Indians
0.1
/100
|
#294
Tragic
$85,571
Immigrants | Grenada
0.1
/100
|
#295
Tragic
$85,552
Immigrants | Zaire
0.1
/100
|
#296
Tragic
$85,207
Fijians
0.1
/100
|
#297
Tragic
$85,187
Africans
0.0
/100
|
#298
Tragic
$84,925
Immigrants | Mexico
0.0
/100
|
#299
Tragic
$84,910
Indonesians
0.0
/100
|
#300
Tragic
$84,890
Potawatomi
0.0
/100
|
#301
Tragic
$84,613
Haitians
0.0
/100
|
#302
Tragic
$84,384
Hondurans
0.0
/100
|
#303
Tragic
$84,079
Ottawa
0.0
/100
|
#304
Tragic
$83,953

Demographics Similar to Ethiopians by Householder Income Ages 45 - 64 years

In terms of householder income ages 45 - 64 years, the demographic groups most similar to Ethiopians are Immigrants from Oceania ($103,705, a difference of 0.030%), Norwegian ($103,682, a difference of 0.050%), Immigrants from Uganda ($103,584, a difference of 0.15%), Hungarian ($103,913, a difference of 0.17%), and Luxembourger ($103,536, a difference of 0.19%).
DemographicsRating | RankHouseholder Income Ages 45 - 64 years
Immigrants | Syria
90.7
/100
|
#131
Exceptional
$104,858
Lebanese
90.1
/100
|
#132
Exceptional
$104,734
Arabs
89.3
/100
|
#133
Excellent
$104,566
Canadians
89.3
/100
|
#134
Excellent
$104,560
Brazilians
88.6
/100
|
#135
Excellent
$104,408
Taiwanese
87.4
/100
|
#136
Excellent
$104,180
Hungarians
85.8
/100
|
#137
Excellent
$103,913
Ethiopians
84.7
/100
|
#138
Excellent
$103,736
Immigrants | Oceania
84.5
/100
|
#139
Excellent
$103,705
Norwegians
84.3
/100
|
#140
Excellent
$103,682
Immigrants | Uganda
83.7
/100
|
#141
Excellent
$103,584
Luxembourgers
83.3
/100
|
#142
Excellent
$103,536
Serbians
83.2
/100
|
#143
Excellent
$103,522
Czechs
83.1
/100
|
#144
Excellent
$103,507
Ugandans
82.9
/100
|
#145
Excellent
$103,472