Paiute vs Ethiopian Householder Income Ages 45 - 64 years
COMPARE
Paiute
Ethiopian
Householder Income Ages 45 - 64 years
Householder Income Ages 45 - 64 years Comparison
Paiute
Ethiopians
$82,629
HOUSEHOLDER INCOME AGES 45 - 64 YEARS
0.0/ 100
METRIC RATING
315th/ 347
METRIC RANK
$103,736
HOUSEHOLDER INCOME AGES 45 - 64 YEARS
84.7/ 100
METRIC RATING
138th/ 347
METRIC RANK
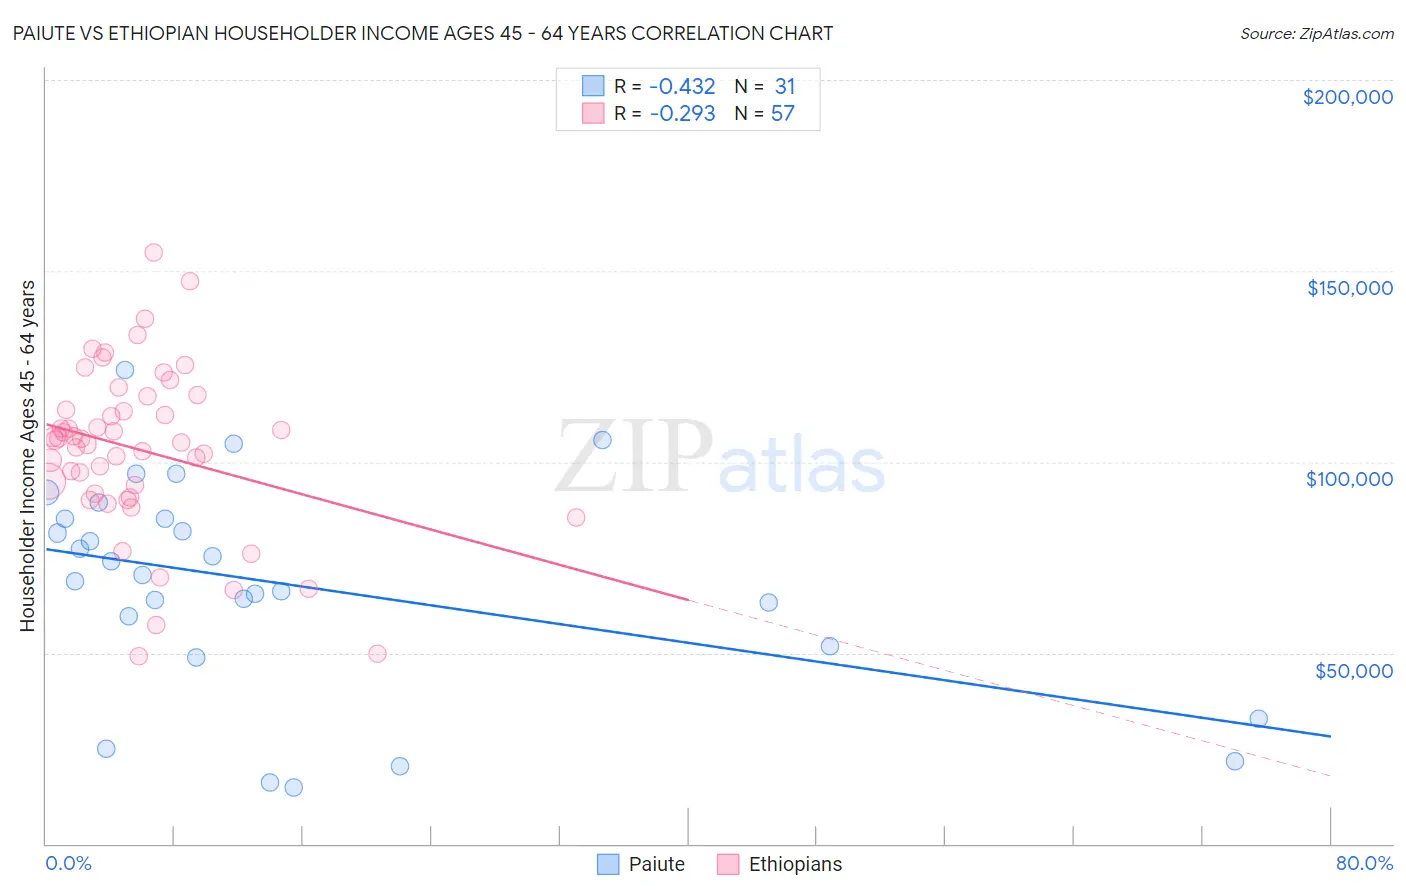
Paiute vs Ethiopian Householder Income Ages 45 - 64 years Correlation Chart
The statistical analysis conducted on geographies consisting of 58,360,777 people shows a moderate negative correlation between the proportion of Paiute and household income with householder between the ages 45 and 64 in the United States with a correlation coefficient (R) of -0.432 and weighted average of $82,629. Similarly, the statistical analysis conducted on geographies consisting of 222,913,789 people shows a weak negative correlation between the proportion of Ethiopians and household income with householder between the ages 45 and 64 in the United States with a correlation coefficient (R) of -0.293 and weighted average of $103,736, a difference of 25.5%.
Householder Income Ages 45 - 64 years Correlation Summary
| Measurement | Paiute | Ethiopian |
| Minimum | $14,844 | $48,981 |
| Maximum | $124,138 | $154,904 |
| Range | $109,294 | $105,923 |
| Mean | $67,796 | $103,166 |
| Median | $70,472 | $105,724 |
| Interquartile 25% (IQ1) | $51,645 | $91,126 |
| Interquartile 75% (IQ3) | $85,268 | $115,330 |
| Interquartile Range (IQR) | $33,623 | $24,204 |
| Standard Deviation (Sample) | $28,134 | $21,688 |
| Standard Deviation (Population) | $27,677 | $21,497 |
Similar Demographics by Householder Income Ages 45 - 64 years
Demographics Similar to Paiute by Householder Income Ages 45 - 64 years
In terms of householder income ages 45 - 64 years, the demographic groups most similar to Paiute are Immigrants from Honduras ($82,697, a difference of 0.080%), U.S. Virgin Islander ($82,736, a difference of 0.13%), Immigrants from Caribbean ($82,513, a difference of 0.14%), Colville ($82,474, a difference of 0.19%), and Choctaw ($82,287, a difference of 0.42%).
| Demographics | Rating | Rank | Householder Income Ages 45 - 64 years |
| Immigrants | Cabo Verde | 0.0 /100 | #308 | Tragic $83,542 |
| Immigrants | Dominica | 0.0 /100 | #309 | Tragic $83,311 |
| Immigrants | Haiti | 0.0 /100 | #310 | Tragic $83,257 |
| Immigrants | Bahamas | 0.0 /100 | #311 | Tragic $83,177 |
| Cajuns | 0.0 /100 | #312 | Tragic $83,015 |
| U.S. Virgin Islanders | 0.0 /100 | #313 | Tragic $82,736 |
| Immigrants | Honduras | 0.0 /100 | #314 | Tragic $82,697 |
| Paiute | 0.0 /100 | #315 | Tragic $82,629 |
| Immigrants | Caribbean | 0.0 /100 | #316 | Tragic $82,513 |
| Colville | 0.0 /100 | #317 | Tragic $82,474 |
| Choctaw | 0.0 /100 | #318 | Tragic $82,287 |
| Chickasaw | 0.0 /100 | #319 | Tragic $82,193 |
| Apache | 0.0 /100 | #320 | Tragic $82,184 |
| Yuman | 0.0 /100 | #321 | Tragic $82,139 |
| Sioux | 0.0 /100 | #322 | Tragic $81,750 |
Demographics Similar to Ethiopians by Householder Income Ages 45 - 64 years
In terms of householder income ages 45 - 64 years, the demographic groups most similar to Ethiopians are Immigrants from Oceania ($103,705, a difference of 0.030%), Norwegian ($103,682, a difference of 0.050%), Immigrants from Uganda ($103,584, a difference of 0.15%), Hungarian ($103,913, a difference of 0.17%), and Luxembourger ($103,536, a difference of 0.19%).
| Demographics | Rating | Rank | Householder Income Ages 45 - 64 years |
| Immigrants | Syria | 90.7 /100 | #131 | Exceptional $104,858 |
| Lebanese | 90.1 /100 | #132 | Exceptional $104,734 |
| Arabs | 89.3 /100 | #133 | Excellent $104,566 |
| Canadians | 89.3 /100 | #134 | Excellent $104,560 |
| Brazilians | 88.6 /100 | #135 | Excellent $104,408 |
| Taiwanese | 87.4 /100 | #136 | Excellent $104,180 |
| Hungarians | 85.8 /100 | #137 | Excellent $103,913 |
| Ethiopians | 84.7 /100 | #138 | Excellent $103,736 |
| Immigrants | Oceania | 84.5 /100 | #139 | Excellent $103,705 |
| Norwegians | 84.3 /100 | #140 | Excellent $103,682 |
| Immigrants | Uganda | 83.7 /100 | #141 | Excellent $103,584 |
| Luxembourgers | 83.3 /100 | #142 | Excellent $103,536 |
| Serbians | 83.2 /100 | #143 | Excellent $103,522 |
| Czechs | 83.1 /100 | #144 | Excellent $103,507 |
| Ugandans | 82.9 /100 | #145 | Excellent $103,472 |