Danish vs Syrian Householder Income Ages 45 - 64 years
COMPARE
Danish
Syrian
Householder Income Ages 45 - 64 years
Householder Income Ages 45 - 64 years Comparison
Danes
Syrians
$105,619
HOUSEHOLDER INCOME AGES 45 - 64 YEARS
93.4/ 100
METRIC RATING
123rd/ 347
METRIC RANK
$107,207
HOUSEHOLDER INCOME AGES 45 - 64 YEARS
96.9/ 100
METRIC RATING
103rd/ 347
METRIC RANK
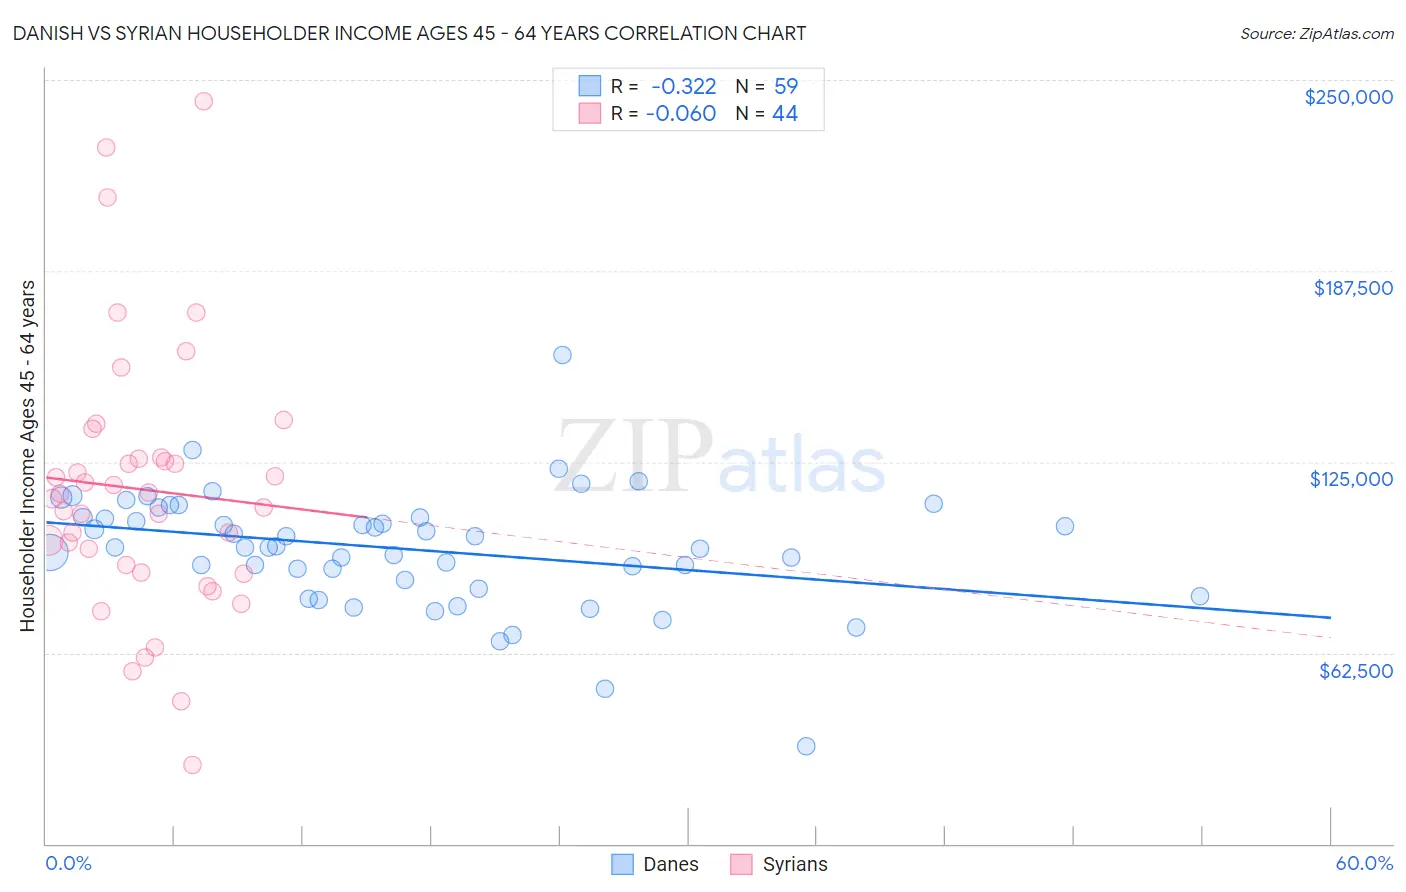
Danish vs Syrian Householder Income Ages 45 - 64 years Correlation Chart
The statistical analysis conducted on geographies consisting of 472,904,213 people shows a mild negative correlation between the proportion of Danes and household income with householder between the ages 45 and 64 in the United States with a correlation coefficient (R) of -0.322 and weighted average of $105,619. Similarly, the statistical analysis conducted on geographies consisting of 266,033,400 people shows a slight negative correlation between the proportion of Syrians and household income with householder between the ages 45 and 64 in the United States with a correlation coefficient (R) of -0.060 and weighted average of $107,207, a difference of 1.5%.
Householder Income Ages 45 - 64 years Correlation Summary
| Measurement | Danish | Syrian |
| Minimum | $31,738 | $25,909 |
| Maximum | $159,821 | $243,024 |
| Range | $128,083 | $217,115 |
| Mean | $96,518 | $115,941 |
| Median | $97,157 | $113,826 |
| Interquartile 25% (IQ1) | $86,244 | $89,983 |
| Interquartile 75% (IQ3) | $106,951 | $126,144 |
| Interquartile Range (IQR) | $20,707 | $36,161 |
| Standard Deviation (Sample) | $19,437 | $43,404 |
| Standard Deviation (Population) | $19,272 | $42,908 |
Demographics Similar to Danes and Syrians by Householder Income Ages 45 - 64 years
In terms of householder income ages 45 - 64 years, the demographic groups most similar to Danes are Immigrants from North Macedonia ($105,892, a difference of 0.26%), Polish ($105,952, a difference of 0.32%), Immigrants from South Eastern Asia ($106,109, a difference of 0.46%), Immigrants from Jordan ($106,164, a difference of 0.52%), and Immigrants from Western Asia ($106,217, a difference of 0.57%). Similarly, the demographic groups most similar to Syrians are Immigrants from Ukraine ($107,079, a difference of 0.12%), Macedonian ($107,074, a difference of 0.12%), Armenian ($107,002, a difference of 0.19%), Immigrants from Fiji ($106,952, a difference of 0.24%), and Zimbabwean ($106,849, a difference of 0.33%).
| Demographics | Rating | Rank | Householder Income Ages 45 - 64 years |
| Syrians | 96.9 /100 | #103 | Exceptional $107,207 |
| Immigrants | Ukraine | 96.7 /100 | #104 | Exceptional $107,079 |
| Macedonians | 96.7 /100 | #105 | Exceptional $107,074 |
| Armenians | 96.6 /100 | #106 | Exceptional $107,002 |
| Immigrants | Fiji | 96.5 /100 | #107 | Exceptional $106,952 |
| Zimbabweans | 96.3 /100 | #108 | Exceptional $106,849 |
| Chileans | 95.9 /100 | #109 | Exceptional $106,611 |
| Immigrants | Brazil | 95.6 /100 | #110 | Exceptional $106,470 |
| Immigrants | Vietnam | 95.5 /100 | #111 | Exceptional $106,417 |
| Swedes | 95.4 /100 | #112 | Exceptional $106,377 |
| Europeans | 95.4 /100 | #113 | Exceptional $106,367 |
| Immigrants | Poland | 95.3 /100 | #114 | Exceptional $106,319 |
| Immigrants | Kuwait | 95.2 /100 | #115 | Exceptional $106,285 |
| British | 95.2 /100 | #116 | Exceptional $106,264 |
| Albanians | 95.1 /100 | #117 | Exceptional $106,243 |
| Immigrants | Western Asia | 95.0 /100 | #118 | Exceptional $106,217 |
| Immigrants | Jordan | 94.9 /100 | #119 | Exceptional $106,164 |
| Immigrants | South Eastern Asia | 94.8 /100 | #120 | Exceptional $106,109 |
| Poles | 94.4 /100 | #121 | Exceptional $105,952 |
| Immigrants | North Macedonia | 94.2 /100 | #122 | Exceptional $105,892 |
| Danes | 93.4 /100 | #123 | Exceptional $105,619 |