Immigrants from Netherlands vs Syrian Householder Income Ages 45 - 64 years
COMPARE
Immigrants from Netherlands
Syrian
Householder Income Ages 45 - 64 years
Householder Income Ages 45 - 64 years Comparison
Immigrants from Netherlands
Syrians
$111,982
HOUSEHOLDER INCOME AGES 45 - 64 YEARS
99.7/ 100
METRIC RATING
60th/ 347
METRIC RANK
$107,207
HOUSEHOLDER INCOME AGES 45 - 64 YEARS
96.9/ 100
METRIC RATING
103rd/ 347
METRIC RANK
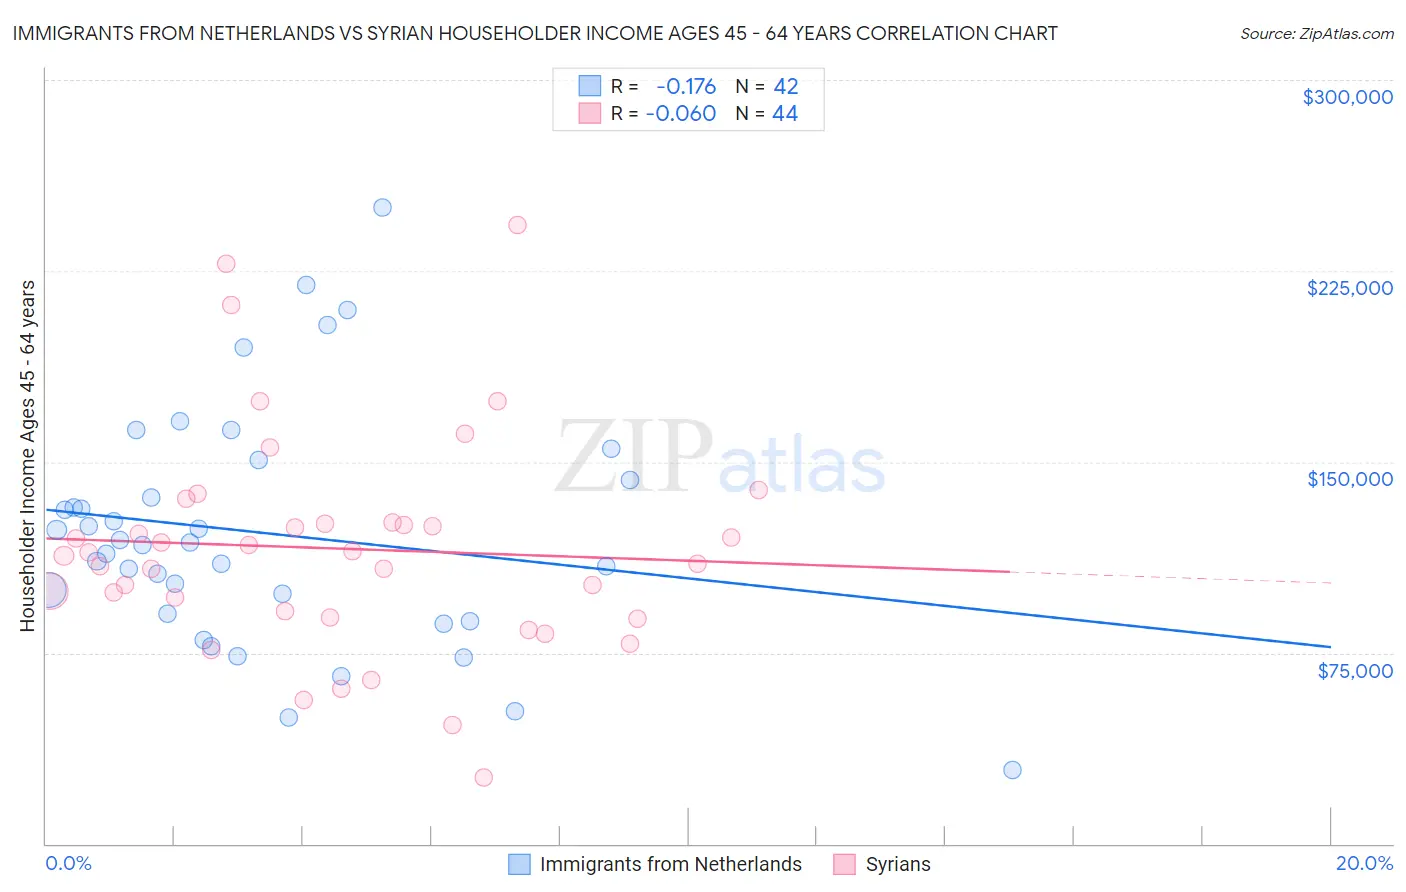
Immigrants from Netherlands vs Syrian Householder Income Ages 45 - 64 years Correlation Chart
The statistical analysis conducted on geographies consisting of 237,641,148 people shows a poor negative correlation between the proportion of Immigrants from Netherlands and household income with householder between the ages 45 and 64 in the United States with a correlation coefficient (R) of -0.176 and weighted average of $111,982. Similarly, the statistical analysis conducted on geographies consisting of 266,033,400 people shows a slight negative correlation between the proportion of Syrians and household income with householder between the ages 45 and 64 in the United States with a correlation coefficient (R) of -0.060 and weighted average of $107,207, a difference of 4.4%.
Householder Income Ages 45 - 64 years Correlation Summary
| Measurement | Immigrants from Netherlands | Syrian |
| Minimum | $28,859 | $25,909 |
| Maximum | $250,001 | $243,024 |
| Range | $221,142 | $217,115 |
| Mean | $122,033 | $115,941 |
| Median | $117,805 | $113,826 |
| Interquartile 25% (IQ1) | $90,138 | $89,983 |
| Interquartile 75% (IQ3) | $142,813 | $126,144 |
| Interquartile Range (IQR) | $52,675 | $36,161 |
| Standard Deviation (Sample) | $46,842 | $43,404 |
| Standard Deviation (Population) | $46,281 | $42,908 |
Similar Demographics by Householder Income Ages 45 - 64 years
Demographics Similar to Immigrants from Netherlands by Householder Income Ages 45 - 64 years
In terms of householder income ages 45 - 64 years, the demographic groups most similar to Immigrants from Netherlands are Immigrants from Europe ($111,984, a difference of 0.0%), Soviet Union ($112,008, a difference of 0.020%), Immigrants from Czechoslovakia ($111,914, a difference of 0.060%), Immigrants from Scotland ($112,175, a difference of 0.17%), and Egyptian ($112,256, a difference of 0.24%).
| Demographics | Rating | Rank | Householder Income Ages 45 - 64 years |
| Afghans | 99.8 /100 | #53 | Exceptional $112,676 |
| Greeks | 99.8 /100 | #54 | Exceptional $112,630 |
| Lithuanians | 99.8 /100 | #55 | Exceptional $112,484 |
| Egyptians | 99.7 /100 | #56 | Exceptional $112,256 |
| Immigrants | Scotland | 99.7 /100 | #57 | Exceptional $112,175 |
| Soviet Union | 99.7 /100 | #58 | Exceptional $112,008 |
| Immigrants | Europe | 99.7 /100 | #59 | Exceptional $111,984 |
| Immigrants | Netherlands | 99.7 /100 | #60 | Exceptional $111,982 |
| Immigrants | Czechoslovakia | 99.7 /100 | #61 | Exceptional $111,914 |
| Immigrants | Norway | 99.7 /100 | #62 | Exceptional $111,669 |
| Mongolians | 99.6 /100 | #63 | Exceptional $111,602 |
| Immigrants | Latvia | 99.6 /100 | #64 | Exceptional $111,454 |
| Immigrants | Belarus | 99.6 /100 | #65 | Exceptional $111,430 |
| New Zealanders | 99.6 /100 | #66 | Exceptional $111,286 |
| Laotians | 99.5 /100 | #67 | Exceptional $111,051 |
Demographics Similar to Syrians by Householder Income Ages 45 - 64 years
In terms of householder income ages 45 - 64 years, the demographic groups most similar to Syrians are Immigrants from Ukraine ($107,079, a difference of 0.12%), Macedonian ($107,074, a difference of 0.12%), Immigrants from Moldova ($107,357, a difference of 0.14%), Immigrants from Kazakhstan ($107,378, a difference of 0.16%), and Armenian ($107,002, a difference of 0.19%).
| Demographics | Rating | Rank | Householder Income Ages 45 - 64 years |
| Immigrants | Argentina | 98.2 /100 | #96 | Exceptional $108,264 |
| Northern Europeans | 97.8 /100 | #97 | Exceptional $107,870 |
| Immigrants | Southern Europe | 97.7 /100 | #98 | Exceptional $107,775 |
| Palestinians | 97.6 /100 | #99 | Exceptional $107,721 |
| Immigrants | Serbia | 97.4 /100 | #100 | Exceptional $107,569 |
| Immigrants | Kazakhstan | 97.2 /100 | #101 | Exceptional $107,378 |
| Immigrants | Moldova | 97.1 /100 | #102 | Exceptional $107,357 |
| Syrians | 96.9 /100 | #103 | Exceptional $107,207 |
| Immigrants | Ukraine | 96.7 /100 | #104 | Exceptional $107,079 |
| Macedonians | 96.7 /100 | #105 | Exceptional $107,074 |
| Armenians | 96.6 /100 | #106 | Exceptional $107,002 |
| Immigrants | Fiji | 96.5 /100 | #107 | Exceptional $106,952 |
| Zimbabweans | 96.3 /100 | #108 | Exceptional $106,849 |
| Chileans | 95.9 /100 | #109 | Exceptional $106,611 |
| Immigrants | Brazil | 95.6 /100 | #110 | Exceptional $106,470 |