Danish vs Uruguayan Householder Income Ages 45 - 64 years
COMPARE
Danish
Uruguayan
Householder Income Ages 45 - 64 years
Householder Income Ages 45 - 64 years Comparison
Danes
Uruguayans
$105,619
HOUSEHOLDER INCOME AGES 45 - 64 YEARS
93.4/ 100
METRIC RATING
123rd/ 347
METRIC RANK
$98,660
HOUSEHOLDER INCOME AGES 45 - 64 YEARS
30.3/ 100
METRIC RATING
194th/ 347
METRIC RANK
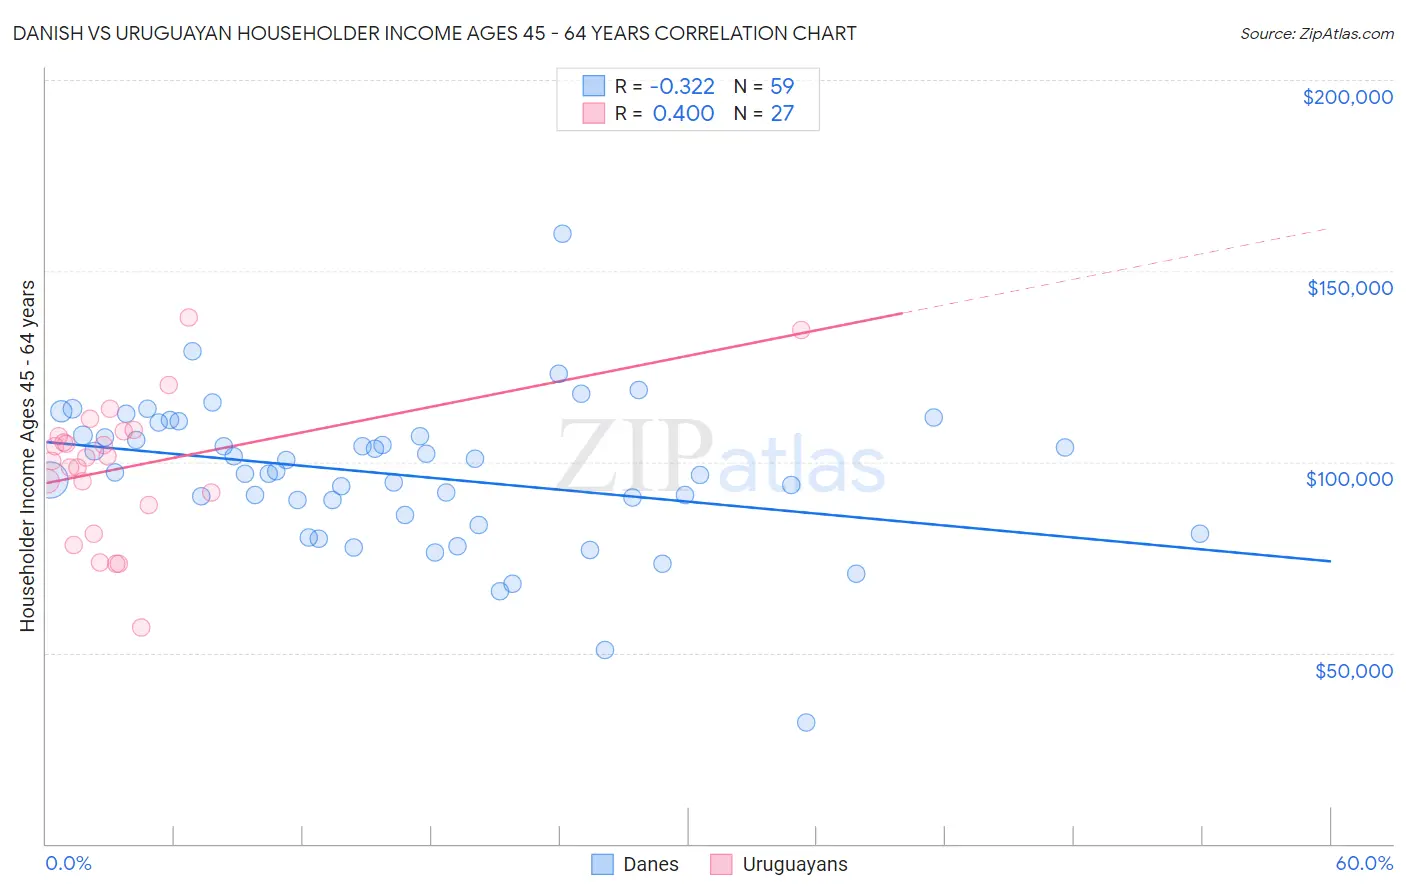
Danish vs Uruguayan Householder Income Ages 45 - 64 years Correlation Chart
The statistical analysis conducted on geographies consisting of 472,904,213 people shows a mild negative correlation between the proportion of Danes and household income with householder between the ages 45 and 64 in the United States with a correlation coefficient (R) of -0.322 and weighted average of $105,619. Similarly, the statistical analysis conducted on geographies consisting of 144,714,251 people shows a moderate positive correlation between the proportion of Uruguayans and household income with householder between the ages 45 and 64 in the United States with a correlation coefficient (R) of 0.400 and weighted average of $98,660, a difference of 7.0%.
Householder Income Ages 45 - 64 years Correlation Summary
| Measurement | Danish | Uruguayan |
| Minimum | $31,738 | $56,731 |
| Maximum | $159,821 | $137,932 |
| Range | $128,083 | $81,201 |
| Mean | $96,518 | $98,728 |
| Median | $97,157 | $101,066 |
| Interquartile 25% (IQ1) | $86,244 | $88,750 |
| Interquartile 75% (IQ3) | $106,951 | $107,917 |
| Interquartile Range (IQR) | $20,707 | $19,167 |
| Standard Deviation (Sample) | $19,437 | $18,259 |
| Standard Deviation (Population) | $19,272 | $17,917 |
Similar Demographics by Householder Income Ages 45 - 64 years
Demographics Similar to Danes by Householder Income Ages 45 - 64 years
In terms of householder income ages 45 - 64 years, the demographic groups most similar to Danes are Immigrants from Northern Africa ($105,430, a difference of 0.18%), Immigrants from North Macedonia ($105,892, a difference of 0.26%), Pakistani ($105,317, a difference of 0.29%), Portuguese ($105,309, a difference of 0.29%), and Polish ($105,952, a difference of 0.32%).
| Demographics | Rating | Rank | Householder Income Ages 45 - 64 years |
| British | 95.2 /100 | #116 | Exceptional $106,264 |
| Albanians | 95.1 /100 | #117 | Exceptional $106,243 |
| Immigrants | Western Asia | 95.0 /100 | #118 | Exceptional $106,217 |
| Immigrants | Jordan | 94.9 /100 | #119 | Exceptional $106,164 |
| Immigrants | South Eastern Asia | 94.8 /100 | #120 | Exceptional $106,109 |
| Poles | 94.4 /100 | #121 | Exceptional $105,952 |
| Immigrants | North Macedonia | 94.2 /100 | #122 | Exceptional $105,892 |
| Danes | 93.4 /100 | #123 | Exceptional $105,619 |
| Immigrants | Northern Africa | 92.8 /100 | #124 | Exceptional $105,430 |
| Pakistanis | 92.4 /100 | #125 | Exceptional $105,317 |
| Portuguese | 92.4 /100 | #126 | Exceptional $105,309 |
| Immigrants | Saudi Arabia | 92.2 /100 | #127 | Exceptional $105,249 |
| Native Hawaiians | 91.8 /100 | #128 | Exceptional $105,149 |
| Peruvians | 91.5 /100 | #129 | Exceptional $105,070 |
| Immigrants | Zimbabwe | 91.2 /100 | #130 | Exceptional $104,992 |
Demographics Similar to Uruguayans by Householder Income Ages 45 - 64 years
In terms of householder income ages 45 - 64 years, the demographic groups most similar to Uruguayans are Spanish ($98,554, a difference of 0.11%), Hawaiian ($98,778, a difference of 0.12%), Immigrants from Eastern Africa ($98,467, a difference of 0.20%), Celtic ($98,896, a difference of 0.24%), and Kenyan ($98,970, a difference of 0.31%).
| Demographics | Rating | Rank | Householder Income Ages 45 - 64 years |
| Iraqis | 38.5 /100 | #187 | Fair $99,387 |
| Immigrants | Portugal | 36.3 /100 | #188 | Fair $99,203 |
| Immigrants | South America | 35.4 /100 | #189 | Fair $99,126 |
| French Canadians | 35.1 /100 | #190 | Fair $99,093 |
| Kenyans | 33.7 /100 | #191 | Fair $98,970 |
| Celtics | 32.9 /100 | #192 | Fair $98,896 |
| Hawaiians | 31.6 /100 | #193 | Fair $98,778 |
| Uruguayans | 30.3 /100 | #194 | Fair $98,660 |
| Spanish | 29.2 /100 | #195 | Fair $98,554 |
| Immigrants | Eastern Africa | 28.3 /100 | #196 | Fair $98,467 |
| Puget Sound Salish | 27.0 /100 | #197 | Fair $98,340 |
| Immigrants | Iraq | 25.7 /100 | #198 | Fair $98,201 |
| Whites/Caucasians | 24.6 /100 | #199 | Fair $98,091 |
| Immigrants | Kenya | 23.5 /100 | #200 | Fair $97,964 |
| Yugoslavians | 20.0 /100 | #201 | Fair $97,558 |