Cypriot vs Immigrants from Trinidad and Tobago Householder Income Ages 25 - 44 years
COMPARE
Cypriot
Immigrants from Trinidad and Tobago
Householder Income Ages 25 - 44 years
Householder Income Ages 25 - 44 years Comparison
Cypriots
Immigrants from Trinidad and Tobago
$116,364
HOUSEHOLDER INCOME AGES 25 - 44 YEARS
100.0/ 100
METRIC RATING
16th/ 347
METRIC RANK
$89,748
HOUSEHOLDER INCOME AGES 25 - 44 YEARS
6.5/ 100
METRIC RATING
221st/ 347
METRIC RANK
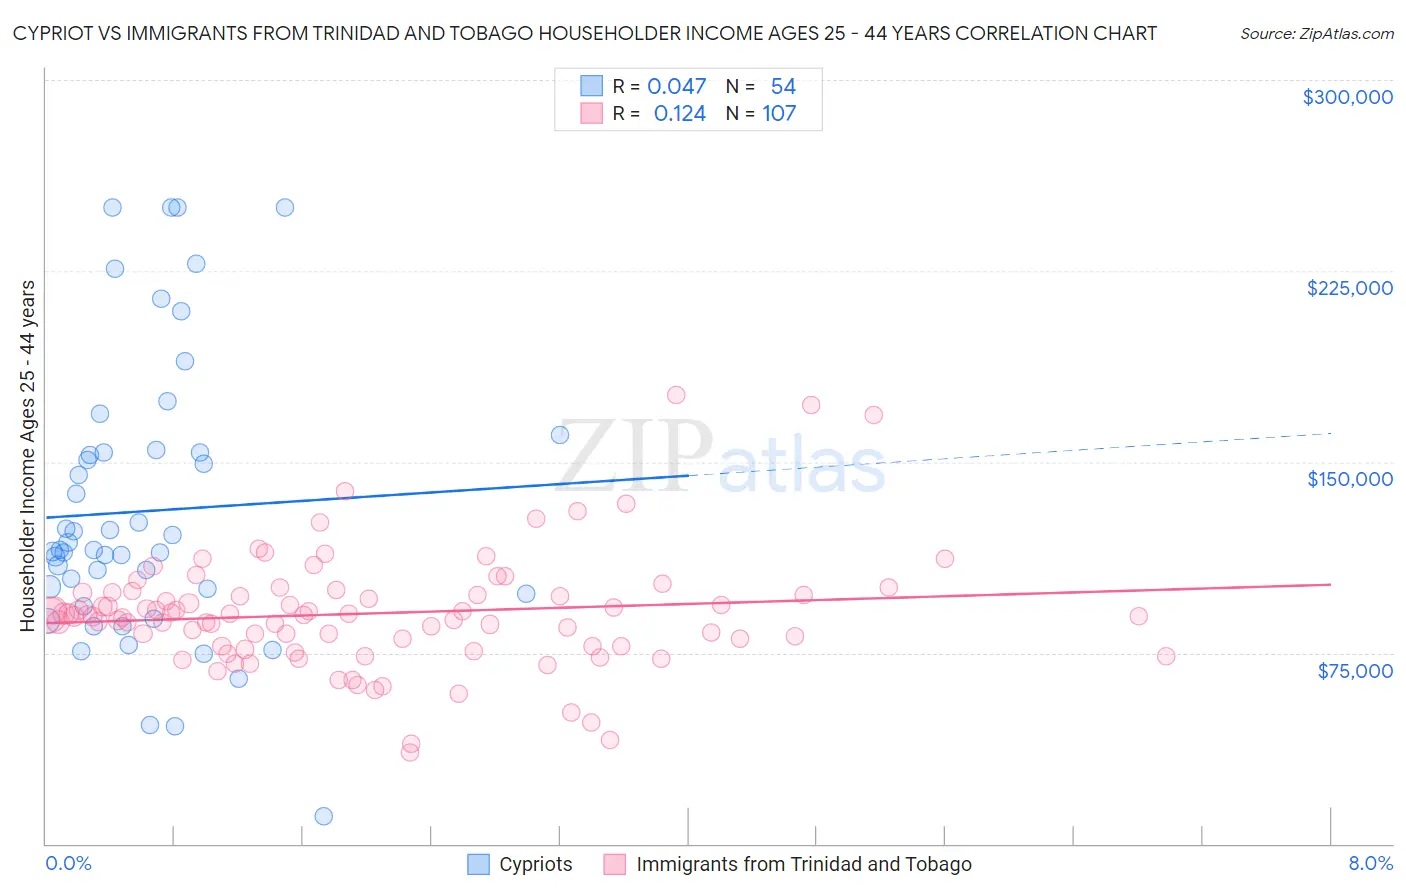
Cypriot vs Immigrants from Trinidad and Tobago Householder Income Ages 25 - 44 years Correlation Chart
The statistical analysis conducted on geographies consisting of 61,825,941 people shows no correlation between the proportion of Cypriots and household income with householder between the ages 25 and 44 in the United States with a correlation coefficient (R) of 0.047 and weighted average of $116,364. Similarly, the statistical analysis conducted on geographies consisting of 223,299,534 people shows a poor positive correlation between the proportion of Immigrants from Trinidad and Tobago and household income with householder between the ages 25 and 44 in the United States with a correlation coefficient (R) of 0.124 and weighted average of $89,748, a difference of 29.7%.
Householder Income Ages 25 - 44 years Correlation Summary
| Measurement | Cypriot | Immigrants from Trinidad and Tobago |
| Minimum | $10,800 | $35,919 |
| Maximum | $250,001 | $176,250 |
| Range | $239,201 | $140,331 |
| Mean | $130,678 | $90,423 |
| Median | $115,469 | $89,618 |
| Interquartile 25% (IQ1) | $98,043 | $77,590 |
| Interquartile 75% (IQ3) | $153,715 | $98,814 |
| Interquartile Range (IQR) | $55,672 | $21,224 |
| Standard Deviation (Sample) | $55,115 | $23,047 |
| Standard Deviation (Population) | $54,602 | $22,939 |
Similar Demographics by Householder Income Ages 25 - 44 years
Demographics Similar to Cypriots by Householder Income Ages 25 - 44 years
In terms of householder income ages 25 - 44 years, the demographic groups most similar to Cypriots are Immigrants from South Central Asia ($116,626, a difference of 0.23%), Immigrants from Australia ($115,947, a difference of 0.36%), Immigrants from Israel ($117,219, a difference of 0.73%), Immigrants from Eastern Asia ($118,056, a difference of 1.5%), and Eastern European ($114,523, a difference of 1.6%).
| Demographics | Rating | Rank | Householder Income Ages 25 - 44 years |
| Immigrants | China | 100.0 /100 | #9 | Exceptional $119,756 |
| Indians (Asian) | 100.0 /100 | #10 | Exceptional $119,496 |
| Okinawans | 100.0 /100 | #11 | Exceptional $119,349 |
| Immigrants | Iran | 100.0 /100 | #12 | Exceptional $119,204 |
| Immigrants | Eastern Asia | 100.0 /100 | #13 | Exceptional $118,056 |
| Immigrants | Israel | 100.0 /100 | #14 | Exceptional $117,219 |
| Immigrants | South Central Asia | 100.0 /100 | #15 | Exceptional $116,626 |
| Cypriots | 100.0 /100 | #16 | Exceptional $116,364 |
| Immigrants | Australia | 100.0 /100 | #17 | Exceptional $115,947 |
| Eastern Europeans | 100.0 /100 | #18 | Exceptional $114,523 |
| Burmese | 100.0 /100 | #19 | Exceptional $113,701 |
| Immigrants | Korea | 100.0 /100 | #20 | Exceptional $113,401 |
| Asians | 100.0 /100 | #21 | Exceptional $112,666 |
| Immigrants | Belgium | 100.0 /100 | #22 | Exceptional $112,575 |
| Immigrants | Japan | 100.0 /100 | #23 | Exceptional $112,228 |
Demographics Similar to Immigrants from Trinidad and Tobago by Householder Income Ages 25 - 44 years
In terms of householder income ages 25 - 44 years, the demographic groups most similar to Immigrants from Trinidad and Tobago are Immigrants from Ecuador ($89,673, a difference of 0.080%), Trinidadian and Tobagonian ($89,856, a difference of 0.12%), Delaware ($89,876, a difference of 0.14%), Immigrants from Guyana ($89,586, a difference of 0.18%), and Barbadian ($89,565, a difference of 0.20%).
| Demographics | Rating | Rank | Householder Income Ages 25 - 44 years |
| Immigrants | Africa | 8.9 /100 | #214 | Tragic $90,372 |
| Panamanians | 8.1 /100 | #215 | Tragic $90,193 |
| Ghanaians | 7.9 /100 | #216 | Tragic $90,137 |
| Scotch-Irish | 7.3 /100 | #217 | Tragic $89,969 |
| Guyanese | 7.1 /100 | #218 | Tragic $89,940 |
| Delaware | 6.9 /100 | #219 | Tragic $89,876 |
| Trinidadians and Tobagonians | 6.8 /100 | #220 | Tragic $89,856 |
| Immigrants | Trinidad and Tobago | 6.5 /100 | #221 | Tragic $89,748 |
| Immigrants | Ecuador | 6.2 /100 | #222 | Tragic $89,673 |
| Immigrants | Guyana | 5.9 /100 | #223 | Tragic $89,586 |
| Barbadians | 5.9 /100 | #224 | Tragic $89,565 |
| Immigrants | Panama | 5.5 /100 | #225 | Tragic $89,451 |
| Immigrants | Iraq | 5.5 /100 | #226 | Tragic $89,444 |
| Immigrants | St. Vincent and the Grenadines | 4.1 /100 | #227 | Tragic $88,888 |
| Immigrants | Bosnia and Herzegovina | 4.0 /100 | #228 | Tragic $88,819 |