Immigrants from Netherlands vs Immigrants from Yemen Householder Income Over 65 years
COMPARE
Immigrants from Netherlands
Immigrants from Yemen
Householder Income Over 65 years
Householder Income Over 65 years Comparison
Immigrants from Netherlands
Immigrants from Yemen
$66,463
HOUSEHOLDER INCOME OVER 65 YEARS
99.7/ 100
METRIC RATING
54th/ 347
METRIC RANK
$47,527
HOUSEHOLDER INCOME OVER 65 YEARS
0.0/ 100
METRIC RATING
340th/ 347
METRIC RANK
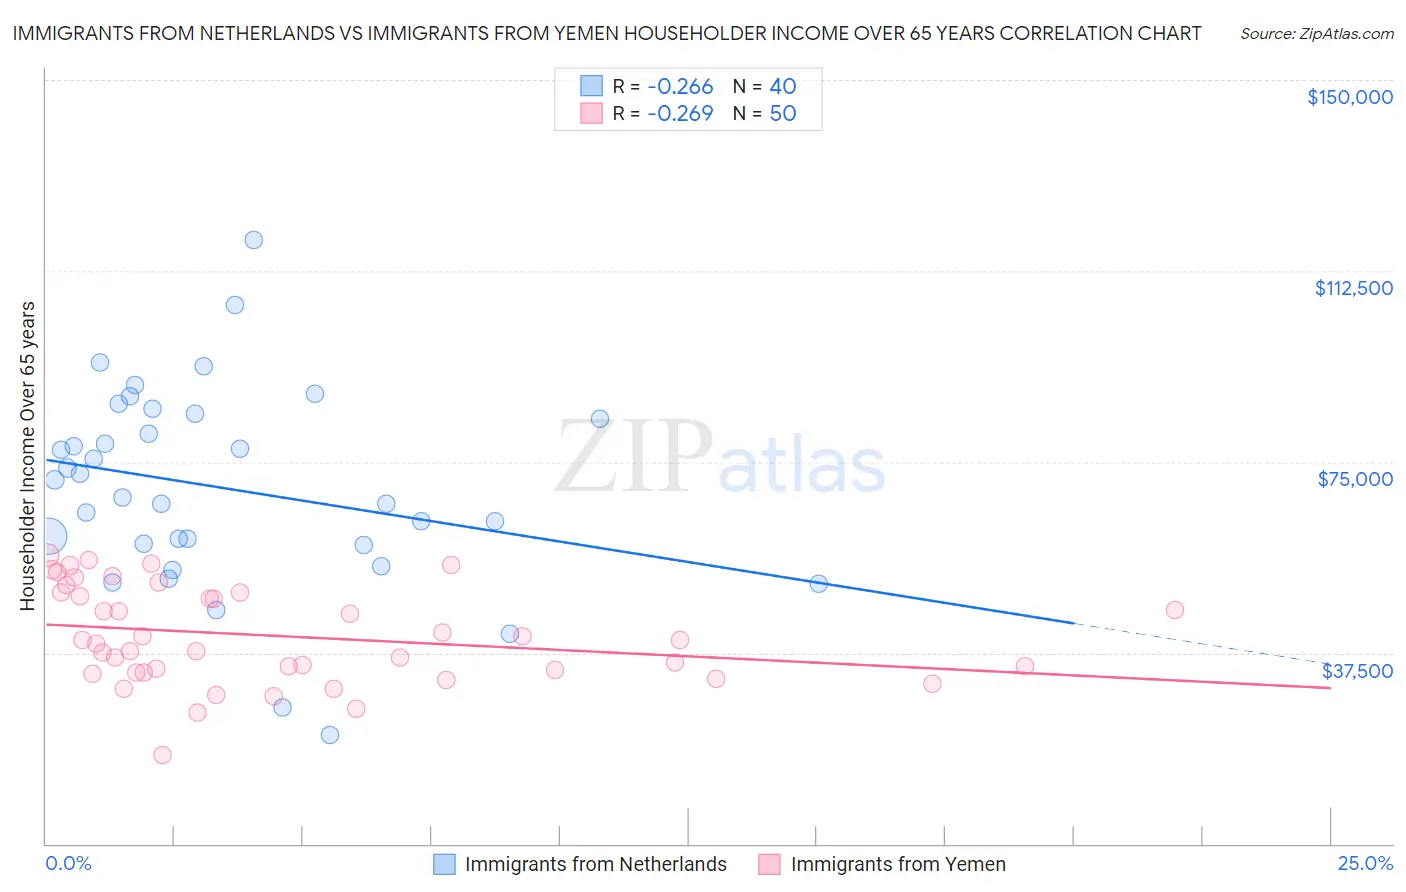
Immigrants from Netherlands vs Immigrants from Yemen Householder Income Over 65 years Correlation Chart
The statistical analysis conducted on geographies consisting of 237,577,957 people shows a weak negative correlation between the proportion of Immigrants from Netherlands and household income with householder over the age of 65 in the United States with a correlation coefficient (R) of -0.266 and weighted average of $66,463. Similarly, the statistical analysis conducted on geographies consisting of 82,406,704 people shows a weak negative correlation between the proportion of Immigrants from Yemen and household income with householder over the age of 65 in the United States with a correlation coefficient (R) of -0.269 and weighted average of $47,527, a difference of 39.8%.
Householder Income Over 65 years Correlation Summary
| Measurement | Immigrants from Netherlands | Immigrants from Yemen |
| Minimum | $21,380 | $17,404 |
| Maximum | $118,574 | $56,646 |
| Range | $97,194 | $39,242 |
| Mean | $69,853 | $40,803 |
| Median | $69,767 | $39,631 |
| Interquartile 25% (IQ1) | $58,822 | $33,662 |
| Interquartile 75% (IQ3) | $83,878 | $49,266 |
| Interquartile Range (IQR) | $25,055 | $15,604 |
| Standard Deviation (Sample) | $19,636 | $9,491 |
| Standard Deviation (Population) | $19,389 | $9,395 |
Similar Demographics by Householder Income Over 65 years
Demographics Similar to Immigrants from Netherlands by Householder Income Over 65 years
In terms of householder income over 65 years, the demographic groups most similar to Immigrants from Netherlands are Immigrants from Czechoslovakia ($66,376, a difference of 0.13%), Immigrants from Pakistan ($66,617, a difference of 0.23%), Immigrants from Scotland ($66,620, a difference of 0.24%), Laotian ($66,306, a difference of 0.24%), and Israeli ($66,636, a difference of 0.26%).
| Demographics | Rating | Rank | Householder Income Over 65 years |
| Australians | 99.8 /100 | #47 | Exceptional $66,891 |
| Immigrants | France | 99.8 /100 | #48 | Exceptional $66,826 |
| Immigrants | Indonesia | 99.8 /100 | #49 | Exceptional $66,694 |
| Immigrants | Turkey | 99.7 /100 | #50 | Exceptional $66,672 |
| Israelis | 99.7 /100 | #51 | Exceptional $66,636 |
| Immigrants | Scotland | 99.7 /100 | #52 | Exceptional $66,620 |
| Immigrants | Pakistan | 99.7 /100 | #53 | Exceptional $66,617 |
| Immigrants | Netherlands | 99.7 /100 | #54 | Exceptional $66,463 |
| Immigrants | Czechoslovakia | 99.7 /100 | #55 | Exceptional $66,376 |
| Laotians | 99.6 /100 | #56 | Exceptional $66,306 |
| Bulgarians | 99.6 /100 | #57 | Exceptional $66,236 |
| Immigrants | Philippines | 99.6 /100 | #58 | Exceptional $66,161 |
| Immigrants | Norway | 99.5 /100 | #59 | Exceptional $66,118 |
| Immigrants | Lithuania | 99.5 /100 | #60 | Exceptional $66,087 |
| Maltese | 99.5 /100 | #61 | Exceptional $66,027 |
Demographics Similar to Immigrants from Yemen by Householder Income Over 65 years
In terms of householder income over 65 years, the demographic groups most similar to Immigrants from Yemen are Navajo ($47,722, a difference of 0.41%), Dominican ($46,964, a difference of 1.2%), Immigrants from Cabo Verde ($46,654, a difference of 1.9%), Immigrants from Caribbean ($48,535, a difference of 2.1%), and Tohono O'odham ($49,121, a difference of 3.4%).
| Demographics | Rating | Rank | Householder Income Over 65 years |
| Cape Verdeans | 0.0 /100 | #333 | Tragic $50,077 |
| Immigrants | Dominica | 0.0 /100 | #334 | Tragic $50,071 |
| Crow | 0.0 /100 | #335 | Tragic $49,234 |
| Cubans | 0.0 /100 | #336 | Tragic $49,152 |
| Tohono O'odham | 0.0 /100 | #337 | Tragic $49,121 |
| Immigrants | Caribbean | 0.0 /100 | #338 | Tragic $48,535 |
| Navajo | 0.0 /100 | #339 | Tragic $47,722 |
| Immigrants | Yemen | 0.0 /100 | #340 | Tragic $47,527 |
| Dominicans | 0.0 /100 | #341 | Tragic $46,964 |
| Immigrants | Cabo Verde | 0.0 /100 | #342 | Tragic $46,654 |
| Immigrants | Dominican Republic | 0.0 /100 | #343 | Tragic $45,758 |
| Houma | 0.0 /100 | #344 | Tragic $44,822 |
| Immigrants | Cuba | 0.0 /100 | #345 | Tragic $44,735 |
| Puerto Ricans | 0.0 /100 | #346 | Tragic $42,550 |
| Lumbee | 0.0 /100 | #347 | Tragic $40,550 |