Chippewa vs Indonesian Median Family Income
COMPARE
Chippewa
Indonesian
Median Family Income
Median Family Income Comparison
Chippewa
Indonesians
$86,852
MEDIAN FAMILY INCOME
0.0/ 100
METRIC RATING
299th/ 347
METRIC RANK
$88,301
MEDIAN FAMILY INCOME
0.1/ 100
METRIC RATING
284th/ 347
METRIC RANK
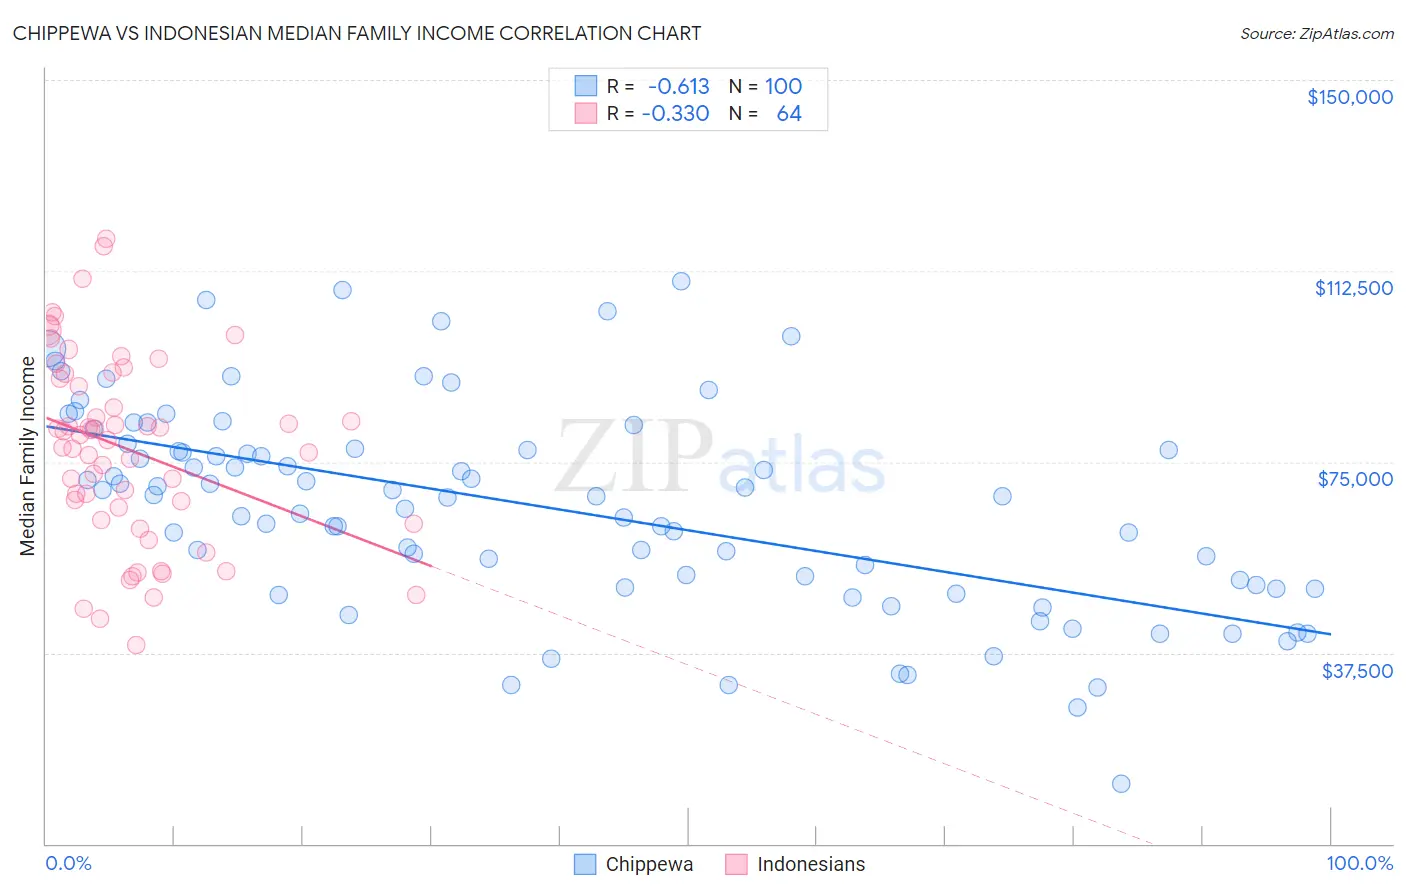
Chippewa vs Indonesian Median Family Income Correlation Chart
The statistical analysis conducted on geographies consisting of 214,970,726 people shows a significant negative correlation between the proportion of Chippewa and median family income in the United States with a correlation coefficient (R) of -0.613 and weighted average of $86,852. Similarly, the statistical analysis conducted on geographies consisting of 162,594,892 people shows a mild negative correlation between the proportion of Indonesians and median family income in the United States with a correlation coefficient (R) of -0.330 and weighted average of $88,301, a difference of 1.7%.
Median Family Income Correlation Summary
| Measurement | Chippewa | Indonesian |
| Minimum | $11,667 | $39,136 |
| Maximum | $110,455 | $118,875 |
| Range | $98,788 | $79,739 |
| Mean | $65,965 | $77,501 |
| Median | $68,273 | $79,746 |
| Interquartile 25% (IQ1) | $50,598 | $64,843 |
| Interquartile 75% (IQ3) | $77,379 | $91,846 |
| Interquartile Range (IQR) | $26,781 | $27,003 |
| Standard Deviation (Sample) | $20,173 | $18,499 |
| Standard Deviation (Population) | $20,072 | $18,353 |
Demographics Similar to Chippewa and Indonesians by Median Family Income
In terms of median family income, the demographic groups most similar to Chippewa are Immigrants from Latin America ($86,989, a difference of 0.16%), Cajun ($87,157, a difference of 0.35%), Immigrants from Guatemala ($87,191, a difference of 0.39%), Yaqui ($87,289, a difference of 0.50%), and Ottawa ($86,380, a difference of 0.55%). Similarly, the demographic groups most similar to Indonesians are Guatemalan ($88,295, a difference of 0.010%), Immigrants from Nicaragua ($88,267, a difference of 0.040%), Potawatomi ($88,265, a difference of 0.040%), Bangladeshi ($88,358, a difference of 0.060%), and Cherokee ($88,209, a difference of 0.10%).
| Demographics | Rating | Rank | Median Family Income |
| Blackfeet | 0.1 /100 | #281 | Tragic $88,717 |
| Comanche | 0.1 /100 | #282 | Tragic $88,556 |
| Bangladeshis | 0.1 /100 | #283 | Tragic $88,358 |
| Indonesians | 0.1 /100 | #284 | Tragic $88,301 |
| Guatemalans | 0.1 /100 | #285 | Tragic $88,295 |
| Immigrants | Nicaragua | 0.1 /100 | #286 | Tragic $88,267 |
| Potawatomi | 0.1 /100 | #287 | Tragic $88,265 |
| Cherokee | 0.1 /100 | #288 | Tragic $88,209 |
| Central American Indians | 0.1 /100 | #289 | Tragic $88,034 |
| Shoshone | 0.1 /100 | #290 | Tragic $87,872 |
| Immigrants | Cabo Verde | 0.1 /100 | #291 | Tragic $87,830 |
| Africans | 0.1 /100 | #292 | Tragic $87,820 |
| Ute | 0.0 /100 | #293 | Tragic $87,596 |
| Fijians | 0.0 /100 | #294 | Tragic $87,387 |
| Yaqui | 0.0 /100 | #295 | Tragic $87,289 |
| Immigrants | Guatemala | 0.0 /100 | #296 | Tragic $87,191 |
| Cajuns | 0.0 /100 | #297 | Tragic $87,157 |
| Immigrants | Latin America | 0.0 /100 | #298 | Tragic $86,989 |
| Chippewa | 0.0 /100 | #299 | Tragic $86,852 |
| Ottawa | 0.0 /100 | #300 | Tragic $86,380 |
| Colville | 0.0 /100 | #301 | Tragic $85,792 |