Chilean vs Native Hawaiian Householder Income Ages 25 - 44 years
COMPARE
Chilean
Native Hawaiian
Householder Income Ages 25 - 44 years
Householder Income Ages 25 - 44 years Comparison
Chileans
Native Hawaiians
$99,900
HOUSEHOLDER INCOME AGES 25 - 44 YEARS
95.1/ 100
METRIC RATING
111th/ 347
METRIC RANK
$95,058
HOUSEHOLDER INCOME AGES 25 - 44 YEARS
56.8/ 100
METRIC RATING
169th/ 347
METRIC RANK
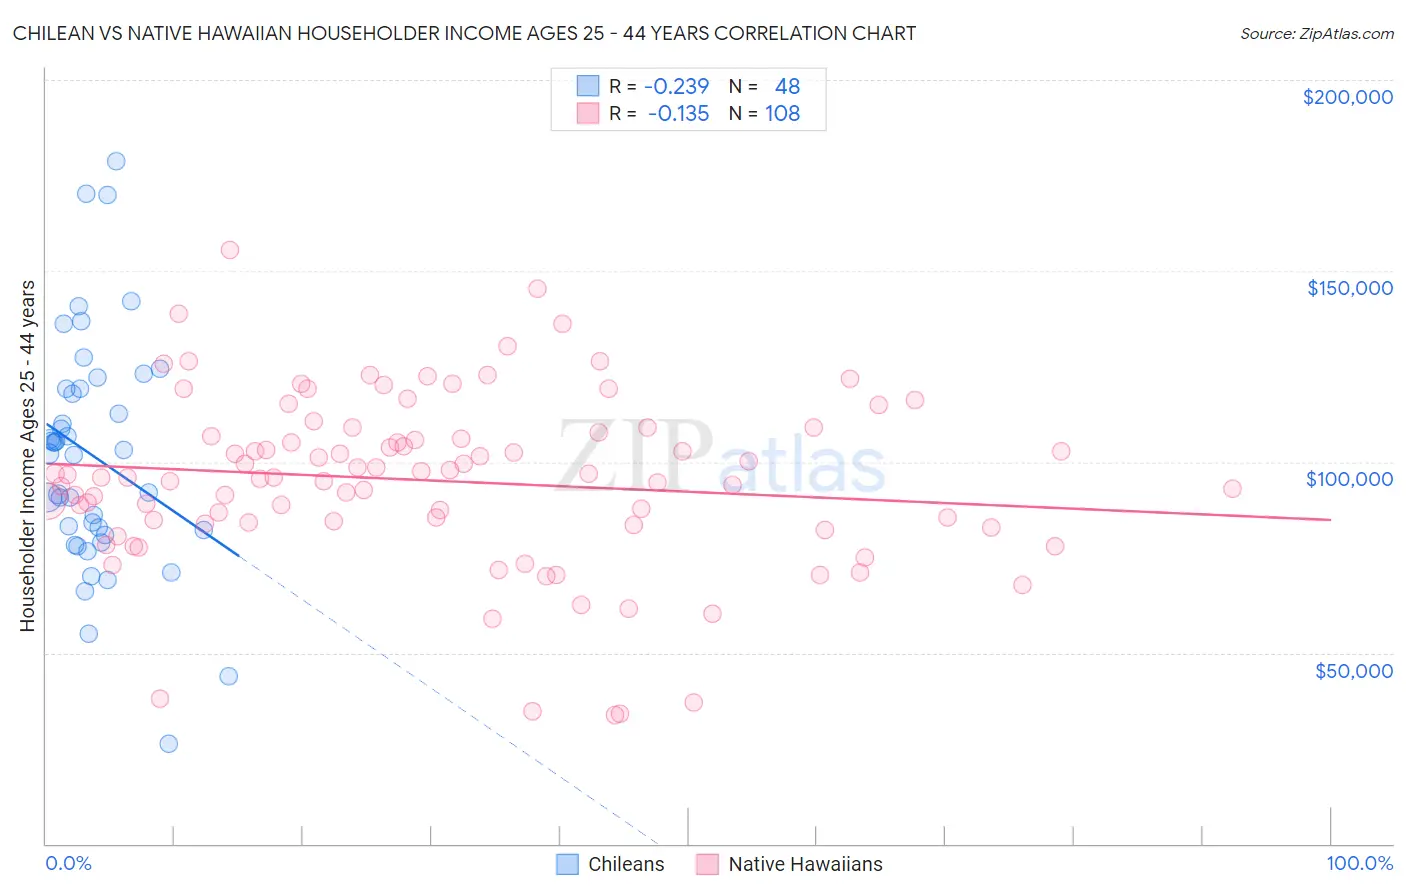
Chilean vs Native Hawaiian Householder Income Ages 25 - 44 years Correlation Chart
The statistical analysis conducted on geographies consisting of 256,390,740 people shows a weak negative correlation between the proportion of Chileans and household income with householder between the ages 25 and 44 in the United States with a correlation coefficient (R) of -0.239 and weighted average of $99,900. Similarly, the statistical analysis conducted on geographies consisting of 331,204,844 people shows a poor negative correlation between the proportion of Native Hawaiians and household income with householder between the ages 25 and 44 in the United States with a correlation coefficient (R) of -0.135 and weighted average of $95,058, a difference of 5.1%.
Householder Income Ages 25 - 44 years Correlation Summary
| Measurement | Chilean | Native Hawaiian |
| Minimum | $26,028 | $33,592 |
| Maximum | $178,828 | $155,455 |
| Range | $152,800 | $121,863 |
| Mean | $101,398 | $95,050 |
| Median | $102,616 | $96,046 |
| Interquartile 25% (IQ1) | $81,519 | $84,012 |
| Interquartile 75% (IQ3) | $119,228 | $107,169 |
| Interquartile Range (IQR) | $37,709 | $23,157 |
| Standard Deviation (Sample) | $30,801 | $22,678 |
| Standard Deviation (Population) | $30,478 | $22,573 |
Similar Demographics by Householder Income Ages 25 - 44 years
Demographics Similar to Chileans by Householder Income Ages 25 - 44 years
In terms of householder income ages 25 - 44 years, the demographic groups most similar to Chileans are Immigrants from Afghanistan ($99,977, a difference of 0.080%), Immigrants from North Macedonia ($100,101, a difference of 0.20%), Polish ($99,685, a difference of 0.22%), Tongan ($99,604, a difference of 0.30%), and Immigrants from South Eastern Asia ($100,283, a difference of 0.38%).
| Demographics | Rating | Rank | Householder Income Ages 25 - 44 years |
| Immigrants | Poland | 97.4 /100 | #104 | Exceptional $101,065 |
| Immigrants | Vietnam | 96.5 /100 | #105 | Exceptional $100,535 |
| Immigrants | Brazil | 96.5 /100 | #106 | Exceptional $100,534 |
| Northern Europeans | 96.3 /100 | #107 | Exceptional $100,457 |
| Immigrants | South Eastern Asia | 96.0 /100 | #108 | Exceptional $100,283 |
| Immigrants | North Macedonia | 95.6 /100 | #109 | Exceptional $100,101 |
| Immigrants | Afghanistan | 95.3 /100 | #110 | Exceptional $99,977 |
| Chileans | 95.1 /100 | #111 | Exceptional $99,900 |
| Poles | 94.5 /100 | #112 | Exceptional $99,685 |
| Tongans | 94.2 /100 | #113 | Exceptional $99,604 |
| Immigrants | Western Asia | 94.0 /100 | #114 | Exceptional $99,516 |
| Carpatho Rusyns | 93.7 /100 | #115 | Exceptional $99,449 |
| Portuguese | 93.7 /100 | #116 | Exceptional $99,429 |
| Immigrants | Northern Africa | 93.0 /100 | #117 | Exceptional $99,232 |
| Syrians | 92.9 /100 | #118 | Exceptional $99,215 |
Demographics Similar to Native Hawaiians by Householder Income Ages 25 - 44 years
In terms of householder income ages 25 - 44 years, the demographic groups most similar to Native Hawaiians are Alsatian ($95,059, a difference of 0.0%), Czechoslovakian ($95,070, a difference of 0.010%), Slovak ($95,032, a difference of 0.030%), Immigrants from Armenia ($94,867, a difference of 0.20%), and Immigrants from Ethiopia ($95,256, a difference of 0.21%).
| Demographics | Rating | Rank | Householder Income Ages 25 - 44 years |
| Swiss | 62.8 /100 | #162 | Good $95,511 |
| Immigrants | Saudi Arabia | 62.0 /100 | #163 | Good $95,450 |
| South Americans | 60.9 /100 | #164 | Good $95,362 |
| Immigrants | Nepal | 60.3 /100 | #165 | Good $95,322 |
| Immigrants | Ethiopia | 59.5 /100 | #166 | Average $95,256 |
| Czechoslovakians | 57.0 /100 | #167 | Average $95,070 |
| Alsatians | 56.8 /100 | #168 | Average $95,059 |
| Native Hawaiians | 56.8 /100 | #169 | Average $95,058 |
| Slovaks | 56.4 /100 | #170 | Average $95,032 |
| Immigrants | Armenia | 54.2 /100 | #171 | Average $94,867 |
| Scottish | 50.8 /100 | #172 | Average $94,622 |
| Finns | 50.6 /100 | #173 | Average $94,610 |
| Colombians | 50.0 /100 | #174 | Average $94,565 |
| English | 48.1 /100 | #175 | Average $94,429 |
| Immigrants | Immigrants | 48.0 /100 | #176 | Average $94,423 |