Chilean vs Immigrants from Albania Householder Income Ages 25 - 44 years
COMPARE
Chilean
Immigrants from Albania
Householder Income Ages 25 - 44 years
Householder Income Ages 25 - 44 years Comparison
Chileans
Immigrants from Albania
$99,900
HOUSEHOLDER INCOME AGES 25 - 44 YEARS
95.1/ 100
METRIC RATING
111th/ 347
METRIC RANK
$97,929
HOUSEHOLDER INCOME AGES 25 - 44 YEARS
86.6/ 100
METRIC RATING
131st/ 347
METRIC RANK
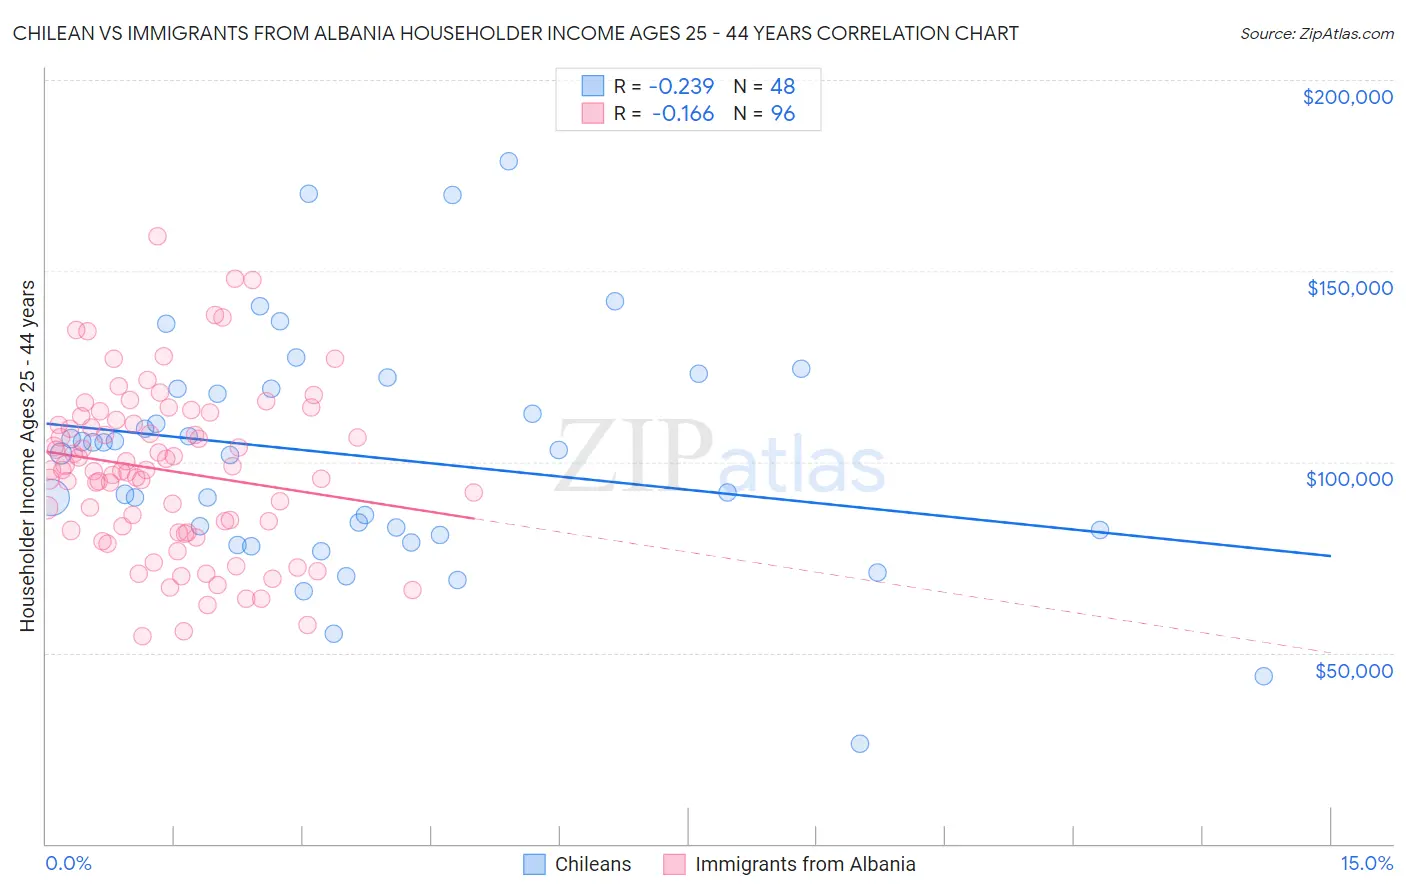
Chilean vs Immigrants from Albania Householder Income Ages 25 - 44 years Correlation Chart
The statistical analysis conducted on geographies consisting of 256,390,740 people shows a weak negative correlation between the proportion of Chileans and household income with householder between the ages 25 and 44 in the United States with a correlation coefficient (R) of -0.239 and weighted average of $99,900. Similarly, the statistical analysis conducted on geographies consisting of 119,323,359 people shows a poor negative correlation between the proportion of Immigrants from Albania and household income with householder between the ages 25 and 44 in the United States with a correlation coefficient (R) of -0.166 and weighted average of $97,929, a difference of 2.0%.
Householder Income Ages 25 - 44 years Correlation Summary
| Measurement | Chilean | Immigrants from Albania |
| Minimum | $26,028 | $54,306 |
| Maximum | $178,828 | $159,200 |
| Range | $152,800 | $104,894 |
| Mean | $101,398 | $97,705 |
| Median | $102,616 | $97,845 |
| Interquartile 25% (IQ1) | $81,519 | $81,795 |
| Interquartile 75% (IQ3) | $119,228 | $110,452 |
| Interquartile Range (IQR) | $37,709 | $28,657 |
| Standard Deviation (Sample) | $30,801 | $21,537 |
| Standard Deviation (Population) | $30,478 | $21,424 |
Demographics Similar to Chileans and Immigrants from Albania by Householder Income Ages 25 - 44 years
In terms of householder income ages 25 - 44 years, the demographic groups most similar to Chileans are Polish ($99,685, a difference of 0.22%), Tongan ($99,604, a difference of 0.30%), Immigrants from Western Asia ($99,516, a difference of 0.39%), Carpatho Rusyn ($99,449, a difference of 0.45%), and Portuguese ($99,429, a difference of 0.47%). Similarly, the demographic groups most similar to Immigrants from Albania are Immigrants from Kuwait ($98,122, a difference of 0.20%), Brazilian ($98,267, a difference of 0.34%), European ($98,310, a difference of 0.39%), Serbian ($98,320, a difference of 0.40%), and British ($98,359, a difference of 0.44%).
| Demographics | Rating | Rank | Householder Income Ages 25 - 44 years |
| Chileans | 95.1 /100 | #111 | Exceptional $99,900 |
| Poles | 94.5 /100 | #112 | Exceptional $99,685 |
| Tongans | 94.2 /100 | #113 | Exceptional $99,604 |
| Immigrants | Western Asia | 94.0 /100 | #114 | Exceptional $99,516 |
| Carpatho Rusyns | 93.7 /100 | #115 | Exceptional $99,449 |
| Portuguese | 93.7 /100 | #116 | Exceptional $99,429 |
| Immigrants | Northern Africa | 93.0 /100 | #117 | Exceptional $99,232 |
| Syrians | 92.9 /100 | #118 | Exceptional $99,215 |
| Jordanians | 92.8 /100 | #119 | Exceptional $99,186 |
| Swedes | 92.7 /100 | #120 | Exceptional $99,136 |
| Peruvians | 91.7 /100 | #121 | Exceptional $98,886 |
| Immigrants | Uzbekistan | 91.5 /100 | #122 | Exceptional $98,849 |
| Palestinians | 91.2 /100 | #123 | Exceptional $98,777 |
| Zimbabweans | 90.3 /100 | #124 | Exceptional $98,586 |
| Pakistanis | 89.3 /100 | #125 | Excellent $98,401 |
| British | 89.1 /100 | #126 | Excellent $98,359 |
| Serbians | 88.9 /100 | #127 | Excellent $98,320 |
| Europeans | 88.9 /100 | #128 | Excellent $98,310 |
| Brazilians | 88.6 /100 | #129 | Excellent $98,267 |
| Immigrants | Kuwait | 87.8 /100 | #130 | Excellent $98,122 |
| Immigrants | Albania | 86.6 /100 | #131 | Excellent $97,929 |