Chickasaw vs Alsatian Median Family Income
COMPARE
Chickasaw
Alsatian
Median Family Income
Median Family Income Comparison
Chickasaw
Alsatians
$85,356
MEDIAN FAMILY INCOME
0.0/ 100
METRIC RATING
307th/ 347
METRIC RANK
$103,010
MEDIAN FAMILY INCOME
54.3/ 100
METRIC RATING
171st/ 347
METRIC RANK
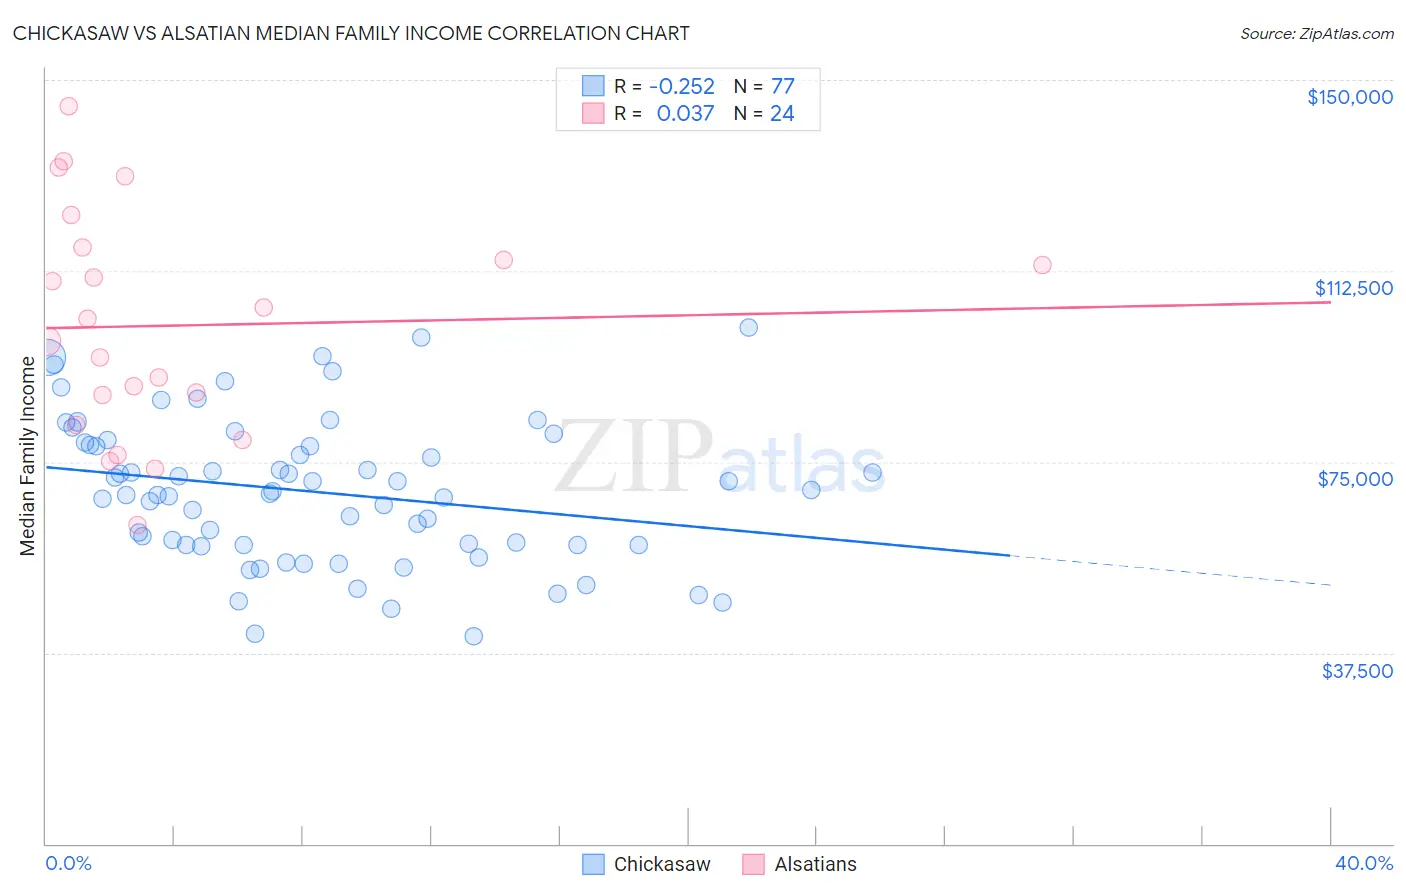
Chickasaw vs Alsatian Median Family Income Correlation Chart
The statistical analysis conducted on geographies consisting of 147,660,168 people shows a weak negative correlation between the proportion of Chickasaw and median family income in the United States with a correlation coefficient (R) of -0.252 and weighted average of $85,356. Similarly, the statistical analysis conducted on geographies consisting of 82,676,924 people shows no correlation between the proportion of Alsatians and median family income in the United States with a correlation coefficient (R) of 0.037 and weighted average of $103,010, a difference of 20.7%.
Median Family Income Correlation Summary
| Measurement | Chickasaw | Alsatian |
| Minimum | $40,774 | $62,500 |
| Maximum | $101,302 | $144,746 |
| Range | $60,528 | $82,246 |
| Mean | $69,119 | $101,763 |
| Median | $68,772 | $100,794 |
| Interquartile 25% (IQ1) | $58,750 | $85,164 |
| Interquartile 75% (IQ3) | $78,533 | $115,830 |
| Interquartile Range (IQR) | $19,783 | $30,667 |
| Standard Deviation (Sample) | $14,096 | $22,004 |
| Standard Deviation (Population) | $14,004 | $21,541 |
Similar Demographics by Median Family Income
Demographics Similar to Chickasaw by Median Family Income
In terms of median family income, the demographic groups most similar to Chickasaw are Immigrants from Dominica ($85,411, a difference of 0.060%), Paiute ($85,414, a difference of 0.070%), U.S. Virgin Islander ($85,294, a difference of 0.070%), Haitian ($85,218, a difference of 0.16%), and Mexican ($85,618, a difference of 0.31%).
| Demographics | Rating | Rank | Median Family Income |
| Ottawa | 0.0 /100 | #300 | Tragic $86,380 |
| Colville | 0.0 /100 | #301 | Tragic $85,792 |
| Spanish American Indians | 0.0 /100 | #302 | Tragic $85,728 |
| Hispanics or Latinos | 0.0 /100 | #303 | Tragic $85,647 |
| Mexicans | 0.0 /100 | #304 | Tragic $85,618 |
| Paiute | 0.0 /100 | #305 | Tragic $85,414 |
| Immigrants | Dominica | 0.0 /100 | #306 | Tragic $85,411 |
| Chickasaw | 0.0 /100 | #307 | Tragic $85,356 |
| U.S. Virgin Islanders | 0.0 /100 | #308 | Tragic $85,294 |
| Haitians | 0.0 /100 | #309 | Tragic $85,218 |
| Immigrants | Central America | 0.0 /100 | #310 | Tragic $85,050 |
| Hondurans | 0.0 /100 | #311 | Tragic $85,004 |
| Cubans | 0.0 /100 | #312 | Tragic $84,981 |
| Choctaw | 0.0 /100 | #313 | Tragic $84,835 |
| Immigrants | Bahamas | 0.0 /100 | #314 | Tragic $84,732 |
Demographics Similar to Alsatians by Median Family Income
In terms of median family income, the demographic groups most similar to Alsatians are Immigrants from Uzbekistan ($103,197, a difference of 0.18%), Immigrants from Eritrea ($102,823, a difference of 0.18%), Belgian ($102,788, a difference of 0.22%), Czechoslovakian ($103,273, a difference of 0.26%), and Finnish ($102,676, a difference of 0.33%).
| Demographics | Rating | Rank | Median Family Income |
| Sierra Leoneans | 64.7 /100 | #164 | Good $103,859 |
| Slovaks | 63.1 /100 | #165 | Good $103,729 |
| English | 62.6 /100 | #166 | Good $103,684 |
| South American Indians | 61.9 /100 | #167 | Good $103,624 |
| Immigrants | Peru | 60.8 /100 | #168 | Good $103,534 |
| Czechoslovakians | 57.6 /100 | #169 | Average $103,273 |
| Immigrants | Uzbekistan | 56.6 /100 | #170 | Average $103,197 |
| Alsatians | 54.3 /100 | #171 | Average $103,010 |
| Immigrants | Eritrea | 51.9 /100 | #172 | Average $102,823 |
| Belgians | 51.4 /100 | #173 | Average $102,788 |
| Finns | 50.0 /100 | #174 | Average $102,676 |
| Immigrants | Eastern Africa | 47.1 /100 | #175 | Average $102,451 |
| French | 46.1 /100 | #176 | Average $102,368 |
| Germans | 44.6 /100 | #177 | Average $102,254 |
| Welsh | 43.3 /100 | #178 | Average $102,151 |