Korean vs Peruvian Median Household Income
COMPARE
Korean
Peruvian
Median Household Income
Median Household Income Comparison
Koreans
Peruvians
$95,018
MEDIAN HOUSEHOLD INCOME
99.8/ 100
METRIC RATING
60th/ 347
METRIC RANK
$90,261
MEDIAN HOUSEHOLD INCOME
96.5/ 100
METRIC RATING
113th/ 347
METRIC RANK
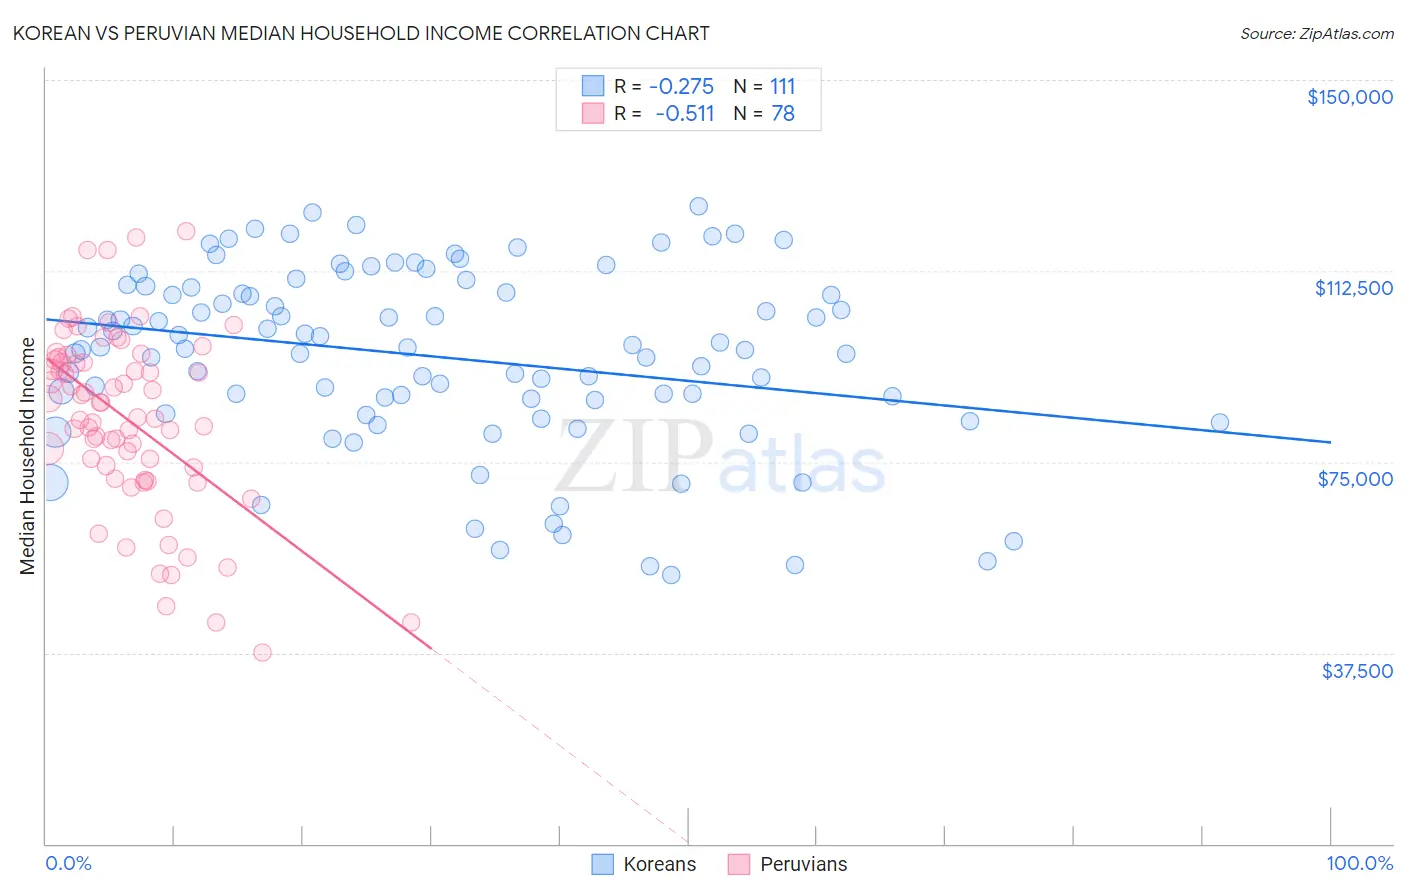
Korean vs Peruvian Median Household Income Correlation Chart
The statistical analysis conducted on geographies consisting of 510,219,050 people shows a weak negative correlation between the proportion of Koreans and median household income in the United States with a correlation coefficient (R) of -0.275 and weighted average of $95,018. Similarly, the statistical analysis conducted on geographies consisting of 362,893,410 people shows a substantial negative correlation between the proportion of Peruvians and median household income in the United States with a correlation coefficient (R) of -0.511 and weighted average of $90,261, a difference of 5.3%.
Median Household Income Correlation Summary
| Measurement | Korean | Peruvian |
| Minimum | $52,792 | $37,557 |
| Maximum | $125,300 | $120,179 |
| Range | $72,508 | $82,622 |
| Mean | $95,651 | $83,404 |
| Median | $97,407 | $85,145 |
| Interquartile 25% (IQ1) | $87,266 | $73,839 |
| Interquartile 75% (IQ3) | $109,366 | $95,038 |
| Interquartile Range (IQR) | $22,100 | $21,199 |
| Standard Deviation (Sample) | $17,558 | $17,709 |
| Standard Deviation (Population) | $17,478 | $17,595 |
Similar Demographics by Median Household Income
Demographics Similar to Koreans by Median Household Income
In terms of median household income, the demographic groups most similar to Koreans are Immigrants from Europe ($95,032, a difference of 0.020%), Laotian ($94,990, a difference of 0.030%), Soviet Union ($95,098, a difference of 0.080%), New Zealander ($95,146, a difference of 0.13%), and Immigrants from Norway ($94,846, a difference of 0.18%).
| Demographics | Rating | Rank | Median Household Income |
| Paraguayans | 99.9 /100 | #53 | Exceptional $95,737 |
| Egyptians | 99.9 /100 | #54 | Exceptional $95,673 |
| Immigrants | Czechoslovakia | 99.9 /100 | #55 | Exceptional $95,319 |
| Immigrants | Austria | 99.9 /100 | #56 | Exceptional $95,277 |
| New Zealanders | 99.8 /100 | #57 | Exceptional $95,146 |
| Soviet Union | 99.8 /100 | #58 | Exceptional $95,098 |
| Immigrants | Europe | 99.8 /100 | #59 | Exceptional $95,032 |
| Koreans | 99.8 /100 | #60 | Exceptional $95,018 |
| Laotians | 99.8 /100 | #61 | Exceptional $94,990 |
| Immigrants | Norway | 99.8 /100 | #62 | Exceptional $94,846 |
| Greeks | 99.8 /100 | #63 | Exceptional $94,735 |
| Immigrants | Netherlands | 99.7 /100 | #64 | Exceptional $94,411 |
| Immigrants | Belarus | 99.7 /100 | #65 | Exceptional $94,399 |
| Immigrants | Romania | 99.7 /100 | #66 | Exceptional $94,222 |
| Immigrants | Scotland | 99.7 /100 | #67 | Exceptional $94,091 |
Demographics Similar to Peruvians by Median Household Income
In terms of median household income, the demographic groups most similar to Peruvians are Northern European ($90,446, a difference of 0.20%), Immigrants from Northern Africa ($90,026, a difference of 0.26%), Immigrants from Western Asia ($90,005, a difference of 0.28%), Immigrants from Poland ($90,549, a difference of 0.32%), and Palestinian ($90,574, a difference of 0.35%).
| Demographics | Rating | Rank | Median Household Income |
| Macedonians | 97.4 /100 | #106 | Exceptional $90,761 |
| Croatians | 97.3 /100 | #107 | Exceptional $90,685 |
| Zimbabweans | 97.2 /100 | #108 | Exceptional $90,618 |
| Chileans | 97.2 /100 | #109 | Exceptional $90,605 |
| Palestinians | 97.1 /100 | #110 | Exceptional $90,574 |
| Immigrants | Poland | 97.1 /100 | #111 | Exceptional $90,549 |
| Northern Europeans | 96.9 /100 | #112 | Exceptional $90,446 |
| Peruvians | 96.5 /100 | #113 | Exceptional $90,261 |
| Immigrants | Northern Africa | 95.9 /100 | #114 | Exceptional $90,026 |
| Immigrants | Western Asia | 95.9 /100 | #115 | Exceptional $90,005 |
| Native Hawaiians | 95.7 /100 | #116 | Exceptional $89,919 |
| Taiwanese | 95.6 /100 | #117 | Exceptional $89,900 |
| Syrians | 95.4 /100 | #118 | Exceptional $89,830 |
| Albanians | 95.2 /100 | #119 | Exceptional $89,744 |
| Immigrants | North Macedonia | 95.2 /100 | #120 | Exceptional $89,741 |