Cape Verdean vs Immigrants from Grenada Householder Income Under 25 years
COMPARE
Cape Verdean
Immigrants from Grenada
Householder Income Under 25 years
Householder Income Under 25 years Comparison
Cape Verdeans
Immigrants from Grenada
$51,387
HOUSEHOLDER INCOME UNDER 25 YEARS
12.3/ 100
METRIC RATING
205th/ 347
METRIC RANK
$54,538
HOUSEHOLDER INCOME UNDER 25 YEARS
99.7/ 100
METRIC RATING
74th/ 347
METRIC RANK
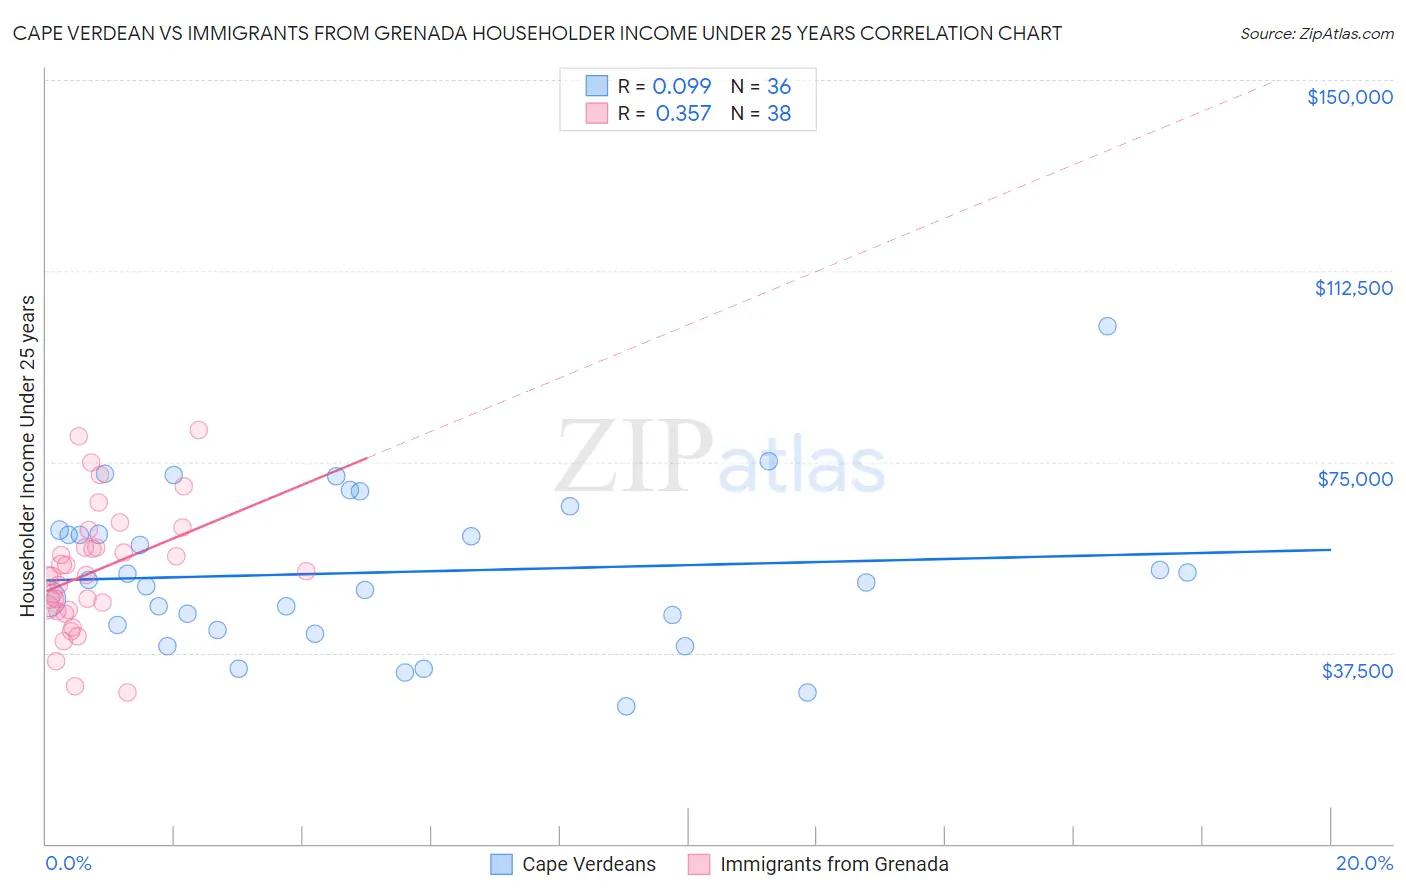
Cape Verdean vs Immigrants from Grenada Householder Income Under 25 years Correlation Chart
The statistical analysis conducted on geographies consisting of 98,258,749 people shows a slight positive correlation between the proportion of Cape Verdeans and household income with householder under the age of 25 in the United States with a correlation coefficient (R) of 0.099 and weighted average of $51,387. Similarly, the statistical analysis conducted on geographies consisting of 61,114,075 people shows a mild positive correlation between the proportion of Immigrants from Grenada and household income with householder under the age of 25 in the United States with a correlation coefficient (R) of 0.357 and weighted average of $54,538, a difference of 6.1%.
Householder Income Under 25 years Correlation Summary
| Measurement | Cape Verdean | Immigrants from Grenada |
| Minimum | $26,996 | $29,811 |
| Maximum | $101,579 | $81,354 |
| Range | $74,583 | $51,543 |
| Mean | $53,331 | $53,537 |
| Median | $51,533 | $52,711 |
| Interquartile 25% (IQ1) | $42,557 | $45,979 |
| Interquartile 75% (IQ3) | $61,225 | $58,278 |
| Interquartile Range (IQR) | $18,668 | $12,299 |
| Standard Deviation (Sample) | $15,423 | $12,149 |
| Standard Deviation (Population) | $15,208 | $11,988 |
Similar Demographics by Householder Income Under 25 years
Demographics Similar to Cape Verdeans by Householder Income Under 25 years
In terms of householder income under 25 years, the demographic groups most similar to Cape Verdeans are Immigrants from Latin America ($51,387, a difference of 0.0%), South African ($51,383, a difference of 0.010%), Immigrants from Jordan ($51,370, a difference of 0.030%), Czech ($51,421, a difference of 0.070%), and Syrian ($51,353, a difference of 0.070%).
| Demographics | Rating | Rank | Householder Income Under 25 years |
| Immigrants | Syria | 15.4 /100 | #198 | Poor $51,494 |
| Swiss | 15.4 /100 | #199 | Poor $51,493 |
| Immigrants | West Indies | 14.9 /100 | #200 | Poor $51,479 |
| British | 14.9 /100 | #201 | Poor $51,477 |
| Immigrants | Guatemala | 14.0 /100 | #202 | Poor $51,447 |
| Immigrants | Cameroon | 13.6 /100 | #203 | Poor $51,433 |
| Czechs | 13.2 /100 | #204 | Poor $51,421 |
| Cape Verdeans | 12.3 /100 | #205 | Poor $51,387 |
| Immigrants | Latin America | 12.3 /100 | #206 | Poor $51,387 |
| South Africans | 12.2 /100 | #207 | Poor $51,383 |
| Immigrants | Jordan | 11.9 /100 | #208 | Poor $51,370 |
| Syrians | 11.4 /100 | #209 | Poor $51,353 |
| Immigrants | Ghana | 10.9 /100 | #210 | Poor $51,333 |
| Irish | 10.6 /100 | #211 | Poor $51,317 |
| Immigrants | Panama | 9.7 /100 | #212 | Tragic $51,278 |
Demographics Similar to Immigrants from Grenada by Householder Income Under 25 years
In terms of householder income under 25 years, the demographic groups most similar to Immigrants from Grenada are Macedonian ($54,563, a difference of 0.050%), Immigrants from Sri Lanka ($54,512, a difference of 0.050%), Immigrants from Northern Europe ($54,571, a difference of 0.060%), Immigrants from Brazil ($54,487, a difference of 0.090%), and Immigrants from Morocco ($54,593, a difference of 0.10%).
| Demographics | Rating | Rank | Householder Income Under 25 years |
| Okinawans | 99.8 /100 | #67 | Exceptional $54,701 |
| Tsimshian | 99.8 /100 | #68 | Exceptional $54,649 |
| Samoans | 99.7 /100 | #69 | Exceptional $54,610 |
| Immigrants | El Salvador | 99.7 /100 | #70 | Exceptional $54,599 |
| Immigrants | Morocco | 99.7 /100 | #71 | Exceptional $54,593 |
| Immigrants | Northern Europe | 99.7 /100 | #72 | Exceptional $54,571 |
| Macedonians | 99.7 /100 | #73 | Exceptional $54,563 |
| Immigrants | Grenada | 99.7 /100 | #74 | Exceptional $54,538 |
| Immigrants | Sri Lanka | 99.7 /100 | #75 | Exceptional $54,512 |
| Immigrants | Brazil | 99.6 /100 | #76 | Exceptional $54,487 |
| Immigrants | Southern Europe | 99.6 /100 | #77 | Exceptional $54,484 |
| Nepalese | 99.6 /100 | #78 | Exceptional $54,472 |
| Immigrants | Italy | 99.6 /100 | #79 | Exceptional $54,449 |
| Egyptians | 99.6 /100 | #80 | Exceptional $54,444 |
| Portuguese | 99.6 /100 | #81 | Exceptional $54,436 |