New Zealander vs Immigrants from Grenada Householder Income Under 25 years
COMPARE
New Zealander
Immigrants from Grenada
Householder Income Under 25 years
Householder Income Under 25 years Comparison
New Zealanders
Immigrants from Grenada
$53,294
HOUSEHOLDER INCOME UNDER 25 YEARS
93.7/ 100
METRIC RATING
129th/ 347
METRIC RANK
$54,538
HOUSEHOLDER INCOME UNDER 25 YEARS
99.7/ 100
METRIC RATING
74th/ 347
METRIC RANK
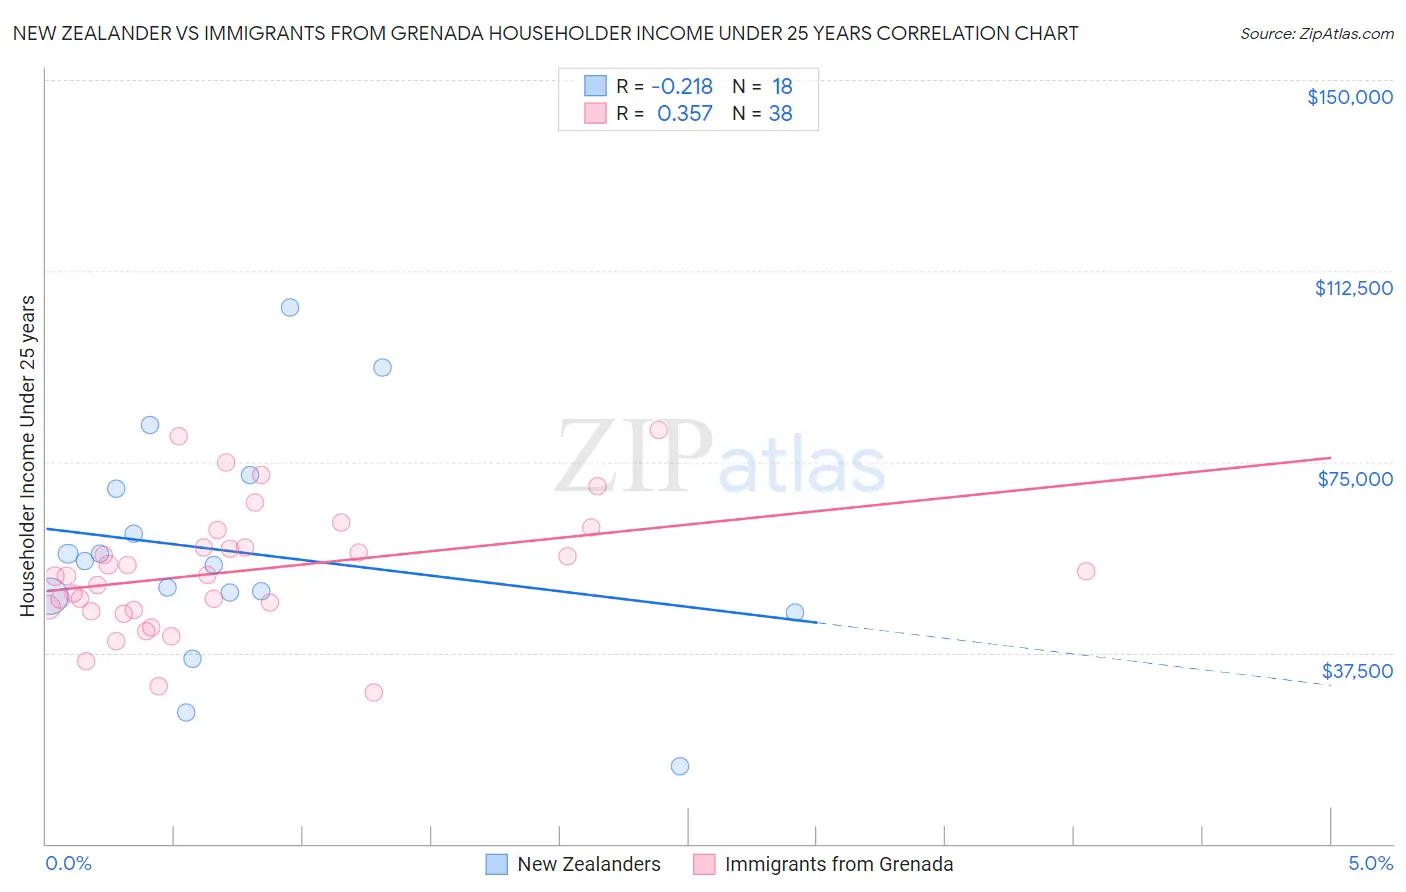
New Zealander vs Immigrants from Grenada Householder Income Under 25 years Correlation Chart
The statistical analysis conducted on geographies consisting of 99,432,414 people shows a weak negative correlation between the proportion of New Zealanders and household income with householder under the age of 25 in the United States with a correlation coefficient (R) of -0.218 and weighted average of $53,294. Similarly, the statistical analysis conducted on geographies consisting of 61,114,075 people shows a mild positive correlation between the proportion of Immigrants from Grenada and household income with householder under the age of 25 in the United States with a correlation coefficient (R) of 0.357 and weighted average of $54,538, a difference of 2.3%.
Householder Income Under 25 years Correlation Summary
| Measurement | New Zealander | Immigrants from Grenada |
| Minimum | $15,332 | $29,811 |
| Maximum | $105,365 | $81,354 |
| Range | $90,033 | $51,543 |
| Mean | $57,183 | $53,537 |
| Median | $55,081 | $52,711 |
| Interquartile 25% (IQ1) | $48,606 | $45,979 |
| Interquartile 75% (IQ3) | $69,807 | $58,278 |
| Interquartile Range (IQR) | $21,201 | $12,299 |
| Standard Deviation (Sample) | $21,993 | $12,149 |
| Standard Deviation (Population) | $21,374 | $11,988 |
Similar Demographics by Householder Income Under 25 years
Demographics Similar to New Zealanders by Householder Income Under 25 years
In terms of householder income under 25 years, the demographic groups most similar to New Zealanders are Immigrants from North America ($53,307, a difference of 0.020%), Immigrants from Bulgaria ($53,305, a difference of 0.020%), Nicaraguan ($53,275, a difference of 0.040%), Immigrants from Serbia ($53,321, a difference of 0.050%), and Immigrants from Nicaragua ($53,266, a difference of 0.050%).
| Demographics | Rating | Rank | Householder Income Under 25 years |
| Immigrants | Ethiopia | 95.2 /100 | #122 | Exceptional $53,408 |
| Immigrants | Iraq | 94.9 /100 | #123 | Exceptional $53,384 |
| Colombians | 94.6 /100 | #124 | Exceptional $53,357 |
| Pakistanis | 94.1 /100 | #125 | Exceptional $53,325 |
| Immigrants | Serbia | 94.1 /100 | #126 | Exceptional $53,321 |
| Immigrants | North America | 93.9 /100 | #127 | Exceptional $53,307 |
| Immigrants | Bulgaria | 93.9 /100 | #128 | Exceptional $53,305 |
| New Zealanders | 93.7 /100 | #129 | Exceptional $53,294 |
| Nicaraguans | 93.4 /100 | #130 | Exceptional $53,275 |
| Immigrants | Nicaragua | 93.3 /100 | #131 | Exceptional $53,266 |
| Moroccans | 93.1 /100 | #132 | Exceptional $53,256 |
| Immigrants | Immigrants | 92.2 /100 | #133 | Exceptional $53,201 |
| Immigrants | Northern Africa | 91.9 /100 | #134 | Exceptional $53,185 |
| Chileans | 91.9 /100 | #135 | Exceptional $53,185 |
| Armenians | 91.8 /100 | #136 | Exceptional $53,179 |
Demographics Similar to Immigrants from Grenada by Householder Income Under 25 years
In terms of householder income under 25 years, the demographic groups most similar to Immigrants from Grenada are Macedonian ($54,563, a difference of 0.050%), Immigrants from Sri Lanka ($54,512, a difference of 0.050%), Immigrants from Northern Europe ($54,571, a difference of 0.060%), Immigrants from Brazil ($54,487, a difference of 0.090%), and Immigrants from Morocco ($54,593, a difference of 0.10%).
| Demographics | Rating | Rank | Householder Income Under 25 years |
| Okinawans | 99.8 /100 | #67 | Exceptional $54,701 |
| Tsimshian | 99.8 /100 | #68 | Exceptional $54,649 |
| Samoans | 99.7 /100 | #69 | Exceptional $54,610 |
| Immigrants | El Salvador | 99.7 /100 | #70 | Exceptional $54,599 |
| Immigrants | Morocco | 99.7 /100 | #71 | Exceptional $54,593 |
| Immigrants | Northern Europe | 99.7 /100 | #72 | Exceptional $54,571 |
| Macedonians | 99.7 /100 | #73 | Exceptional $54,563 |
| Immigrants | Grenada | 99.7 /100 | #74 | Exceptional $54,538 |
| Immigrants | Sri Lanka | 99.7 /100 | #75 | Exceptional $54,512 |
| Immigrants | Brazil | 99.6 /100 | #76 | Exceptional $54,487 |
| Immigrants | Southern Europe | 99.6 /100 | #77 | Exceptional $54,484 |
| Nepalese | 99.6 /100 | #78 | Exceptional $54,472 |
| Immigrants | Italy | 99.6 /100 | #79 | Exceptional $54,449 |
| Egyptians | 99.6 /100 | #80 | Exceptional $54,444 |
| Portuguese | 99.6 /100 | #81 | Exceptional $54,436 |